Download
1 / 72
740 likes | 1.03k Views
Human Health and the Environment. Molly Kile, ScD ENVRE-115 Fall 2010. Announcements. More features added to the course website http://isites.harvard.edu/icb/icb.do?keyword=k72216&pageid=icb.page350713 Class participation is not graded but helps to build a sense of community.

E N D
Human Health and the Environment Molly Kile, ScD ENVRE-115 Fall 2010
Announcements • More featuresadded to the course website http://isites.harvard.edu/icb/icb.do?keyword=k72216&pageid=icb.page350713 • Class participation is not graded but helps to build a sense of community. • Assignment #1 is due today in your drop box • Please check to the drop box to make sure the assignment has been uploaded • Pedagogical goal of assignmentsis to foster critical thinking which involves comparing, contrasting and synthesizing what one has learned which requires being open to new knowledge and actively reflecting on its meaning.
Logistics of Distance Education • Lecture is available as a live streaming feed during class period and are also archived after processing (< 48 hrs) • Chat room is only monitored during class • If you live outside of the New England areayou must arrange for proctored midterm and final exam a minimum of two weeks prior to scheduled exam dates • http://www.extension.harvard.edu/DistanceEd/how-it-works/policy.jsp
Economic Literacy • There is no formal (only suggested) economics prerequisite for this course • Check your economic literacy and review concepts by taking the “Economic Literacy Self Assessment” on the course website. You should be familiar with these terms and concepts before the lecture on October 14. • If you need or want to review economic terminology you can use any undergraduate economics textbook or the “Guidelines for Preparing Economic Analyses” by the US EPA. • http://yosemite.epa.gov/ee/epa/eed.nsf/webpages/Guidelines.html
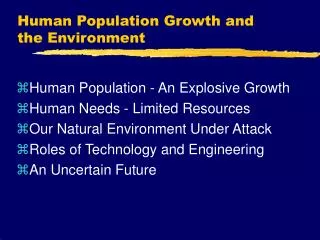
Agenda For Today • Drivers of environmental issues • Demographic and Epidemiological Transition • Demographic dividend • Linkage between human health and development
Underlying Principle Disease, illness and ill-health are not randomly distributed in a population Environment Behaviors Genetics
Tony Fletcher, London School of Hygiene General Environmental Health Definition: • The study of the health effects of all situation and risk factors outside of genetic factors Practical Environmental Health Definition: • The study of exogenous factors over which the affected people have limited individual control
Dominican Republic Haiti
Ramifications of environmental degradation on health … Malnutrition Diminished crops Loss of natural resources Pharmaceutical/Agricultural Vector-borne disease Change in hydrological cycle
Life Expectancy at Birth (2009) Among the Best RankCountryYear 1. Macau 84.4 2. Andorra 82.5 7. Australia 81.6 10. Sweden 80.8 28. Faroe Islands 79.4 50. United States 78.1 • Dominican Rep. 73.7 113. Estonia 72.9 Among the Worst RankCountryYear 159. The World 66.6 • Russia 66.0 178. Botswana 61.9 181. Haiti 60.8 210. Afghanistan 43.34 206. Rwanda 42.73 223. Angola 38.2 224. Swaziland 31.8 Source: CIA, The World Factbook, https://www.cia.gov/library/publications/the-world-factbook/rankorder/2102rank.html
1. Population Growth 12 11 2100 10 Modern 9 Age Old 8 Iron Middle Bronze Stone Age New Stone Age Ages Age Billions Age 7 ~ ? yrs Future ? 6 2000 5 4 1975 3 ~ 50 yrs 1950 2 1900 ~ 125 yrs 1 1800 Black Death — The Plague 2000 1+ million 7000 6000 5000 3000 1000 A.D. 4000 A.D. A.D. A.D. A.D. A.D. years B.C. B.C. B.C. B.C. B.C. B.C. B.C. 1 1000 2000 3000 4000 5000 Source: Population Reference Bureau; and United Nations, World Population Projections to 2100 (1998).
Ehrlich Identity Environmental Impact = Population x Affluence x Technology • The IPAT formulation arose from a dispute in the early 1970s among the most prominent environmental thinkers of the day about the sources of environmental impact • Paul Ehrlich and John Holdren identified population size and growth as the most urgent IPAT factor • Barry Commoner argued that post-World War II production technologies were the dominant reason for environmental degradation • Provides a foundation for the analysis of environmental impacts per capita over time (Ehrlich and Holdren, 1972):
Ehrlich Identity: I=PAT • Environmental Impact is a multiplicative product from small changes in Population, Affluence and Technology • Mathematically represented as: (I + ΔI) = (P + ΔP)(A + ΔA)(T + ΔT) Divide through by the identity (1 + ΔI/I) = (1 + ΔP/P)(1 + ΔA/A)(1 + ΔT/T) Where ΔI/I, ΔP/P, and ΔT/T is the percentage increase in impact, affluence and technology
Quantifying Impact • Example: Lead in gasoline from 1946 to 1968 in the US • Pop. increased 42% • Vehicle mile per capita doubled • Amount of lead per vehicle mile increased 81% (I + ΔI/I) = (P + ΔP/P)(A + ΔA/A)(T + ΔT/T) (1 + ΔI/I) = (1 + 0.42)(1 + 1.0)(1 + 0.81) (1 + ΔI/I) = 5.14 ΔI/I = 5.14 – 1 =4.14 Or 414% increase in lead
Umbilical Cord Lead Levels and IQThe Port Pirie Study Baghurst et al., NEJM 1988
Blood lead of 10 μg/dL=IQ loss of 3 pts(What’s the big deal)
Population Impact Depends on Underlying Distribution 6.0 million Mentally Gifted 6.0 million Mentally Deficient
Public Health Impact of Subclinical Lead Toxicity 57% Increase in Mentally Deficient Population 2.4 million Mentally Gifted 9.4 million Mentally Deficient
Impact of Lead Poisoning Prevention Policies on Reducing Children’s Blood Lead Levels Lead Gasoline Phase-out (1973) 18 16 14 12 10 8 6 4 2 0 ‘74 Lead-based Paint Poisoning Prevention Act (1971) Lead in Plumbing banned (1986) Lead Contamination Control Act (1988) Virtual Elimination of Lead in Gasoline Residential Lead Paint Ban (1978) Lead Title X (1992) Blood Lead Levels (µ/dL) Ban on lead solder in food cans (1995) Housing units with lead based paint hazards reduced by 40% since 1990 ‘72 ‘76 ‘78 ‘80 ‘82 ‘84 ‘86 ‘88 ‘90 ‘92 ‘94 ‘96 ‘98 ‘00 ‘02 ‘04 Year NHANES DATA - CDC
Environmental Justice • US Children Aged 1-5 years with blood lead levels above 10 µg/dl* • 11.2% African American • 2.3% Caucasian * Bernard SM. Should the Centers for Disease Control and Prevention's Childhood Lead Poisoning Intervention level be lowered? AJPH. 93(8):1253-60, Aug 2003. Photograph: Peter Essick for National Geographic
Carrying Capacity Ecological definition: the number of individuals in a population that the resource of a habitat can support Other definitions: Point at which the birth rate equals the death rate The number of individuals an environment can support without significant negative impacts The population size is constrained by whatever resource is in shortest supply (Malthus)
Tragedy of the [Unregulated] CommonsGarrett Hardin “Picture a pasture open to all. It is to be expected that each herdsman will try to keep as many cattle as possible on the commons. Such an arrangement may work reasonably satisfactorily for centuries because tribal wars, poaching, and disease keep the numbers of both man and beast well below the carrying capacity of the land.” What are the consequences of adding one more animal to my herd? • “The population problem has no technical solution; it requires a fundamental extension in morality.” Science 1968
Overshoot • A rapidly growing population can exceed (overshoot) the ecological carrying capacity due to the “momentum” of its growth. • Indicators of Overshoot • Deterioration in renewable resources • Rising levels of pollution • Growing demands by military and industry to secure resources • Investment in human capital postponed to meet immediate consumption demands • Rising debt • Eroding goals for health and environment • Growing instability in natural ecosystems • Growing gap between rich and poor
Ecological Evidence In 1944, 29 reindeer were introduced to St. Matthew Island. In 1963, there were 6,000. One winter later, there were less than 50. By 1980, there were none. Klein, 1968
Human Population Growth Factors that influence human population growth: • Fertility • Age structure of population • Mortality
1. Fertility • Birth rate is defined as the number of live births per 1,000 women aged 15-49 in a given year • Replacement level fertility • Net reproduction rate of 1 • Every woman of childbearing age has 1 daughter • Total fertility rate of 2.1 • Every woman of childbearing age has 2.1 children
Math Behind Exponential Growth Consider a country with 100 people, growing at 7% per year. In 10 years, the population will double to 200 people, in another 10 years it will double again to 400 people, etc (see graph) How long will it take this country to reach 1 million? t = ln [N(t)/N(0)] / r t = ln (1,000,000/100)/0.07 t = ln (10,000)/0.07 t = 9.2103/0.07 t = 131.5 years
Examples 1. How long would it take for a population to double if the growth rate is 3.5%? Doubling Time Time = 70/3.5 = 20 years • A special case is the doubling time, which is the time when N(t)/N(0) = 2. • At that point rt = ln 2 = 0.69. If one knows the growth rate as a decimal fraction, then the Doubling Time = 0.69 / r. • This can be further simplified…the Rule of 70 • Where ,69/r is multiplied by 100 and rounded up to 70. This simplifies to: • Time for population to double = 70/rate expressed as a percentage
US population is growing at a rate of 0.9% per year. How long will it take us to double our population from 307 Million? Time = 70/0.9 = 77 years
Fertility Rates Are Declining Average number of children per woman Source: United Nations, World Population Prospects: The 2004 Revision, 2005.
Factors that influence fertility • The proportion of women of childbearing age who are married or in a sexual union • The percent of women using contraception and the level of abortion • The proportion of women of childbearing age who currently are unable to conceive a child (usually from postpartum infecundity from breastfeeding) • Educational attainment of girls and women
Association Between Fertility and Education of Girls Percent of Girls Enrolled in Secondary School Total Fertility Rate Source: Population Reference Bureau, Population & Economic Development Linkages 2007 Data Sheet.
Association Between Fertility and Female Labor Force Participation Female Labor Force Participation Rate 2004 Total Fertility Rate 2000-2004 Source: United Nations, World Population Prospects: The 2004 Revision, 2005; International Labor Organization, Yearbook of Labor Statistics 2006.
Association between fertility and wealth Average Number of Children Born to a Woman During Her Lifetime Source: ORC Macro, Demographic and Health Surveys.
2. Age Structure of a Population • A large proportion of young people guarantees that population will continue to grow even with declining fertility • Takes two or three generations (70-100 years) before each new birth is offset by a death • Referred to as population momentum
Population MomentumThere is a growing population of women in their childbearing years that will contribute to future world population growth even if fertility continues to decline Source: United Nations, World Population Prospects: The 2004 Revision (medium scenario), 2005.
Population growth rate Birth rate 3. Mortality • Death is the ultimate determinant of population growth • Falling mortality precedes a decline in fertility Rate Death rate Time
How To Shift Causes of Mortality • Improved sanitation and drinking water supplies • Medical advances (vaccination, antibiotics) • Social advances (improved nutrition, access to health care) • Occupational Health & Safety (injury prevention, chemical safety) • Infrastructure Improvements (roadways, housing, energy) • Consumer Safety (injury prevention, chemical safety) • Economic growth
DemographicDividend • Increase in the rate of economic growth due to an increase in the proportion of working age people compared to non-working aged people • Can occur late in the demographic transition when fertility rate falls and the youth dependency rate declines http://www.iiasa.ac.at/Research/LUC/ChinaFood/data/anim/pop_ani.htm Cover from the book by David Cork and Susan Lightstone: The Pig and the Python, How to Prosper from the Aging Baby Boom
Harnessing a Demographic DividendPeople’s Republic of China 1952-1982: Invested in rural health care and education Infant mortality decreased from 200 to 34/1000 live births Life expectancy rose from 35 years to 68 years Fertility rates declined from 6 births/woman (1970) to 3 birth/woman(1979) to “one child” policy in 1980 Universal primary education 1980s: Major policy reform Economic deregulation and liberalization attracted foreign investment and trade Policies promoting gender equality Demographic dividend estimated to contribute 27% of China’s economic growth