Download
1 / 48
560 likes | 911 Views
One, Two or Many Frequencies: Synchrosqueezing and Multicomponent Signal Analysis. Steve McLaughlin Heriot-Watt, School of Engineering & Physical Sciences. with thanks to Patrick Flandrin , Mike Davies, Yannis Kopsinis , Sylvain Meignen , Thomas Oberlin. Structure. Introduction

E N D
One, Two or Many Frequencies:Synchrosqueezing and Multicomponent Signal Analysis Steve McLaughlin Heriot-Watt, School of Engineering & Physical Sciences with thanks to Patrick Flandrin, Mike Davies,YannisKopsinis, Sylvain Meignen, Thomas Oberlin
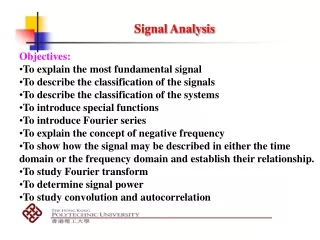
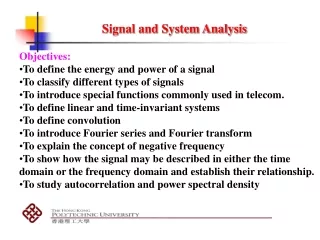
Structure • Introduction • Signals, Time and Frequency • Empirical Mode Decomposition • SynchroSqueezing
What are signals? A signal is a time (or space) varying quantity that can carry information. The concept is broad, and hard to define precisely. (Wikipedia)
Joseph Fourier What are signals made of? The Frequency viewpoint (Fourier): Signals can be built from the sum of harmonic functions (sine waves) signal Harmonic functions Fourier coefficients
What is a Signal? W. Tecumseh Fitch, “Calls out of chaos: the adaptive significance of nonlinear phenomena in mammalian vocal production”, Animal Behaviour, 2002
What is a Signal Frequency modulation (FM) implies the instantaneous frequency varies. This contrasts with amplitude modulation, in which it is the amplitude which is varied while its frequency remains constant. Many signals can be modeled as a sum of AM and FM components.
Empirical Mode Decomposition • Basic idea is very simple: • signal = fast oscillation + slow oscillation • (& iteration) • - Separation “fast vs slow’ data driven • Local analysis based on neighbouring extrema • Oscillation rather than frequency
Empirical Mode Decomposition • Identify local maxima and local minima • Deduce an upper envelope and a lower envelope by interpolation (cubic splines) • subtract the mean envelope from the signal • iterate until “mean envelope = 0" (sifting) • subtract the obtained mode from the signal • iterate on the residual
EMD - Summary • Locality — The method operates at the scale of one oscillation • Adaptive — The decomposition is fully data-driven • Multi-resolution — The iterative process explores sequentially the “natural” scales of a signal • Oscillations of any type — No assumption on the nature of oscillations (e.g., harmonic) ⇒ 1 nonlinear oscillation = 1 mode • No analytic definition — The decomposition is only defined as the output of an algorithm ⇒ analysis and evaluation ?
What is frequency? Frequency is the number of occurrences of a repeating event per unit time. It is also referred to as temporal frequency. The period is the duration of one cycle in a repeating event, so the period is the reciprocal of the frequency. (Wikipedia)
What is frequency? Macaque Fatima Miranda Amolops tormotus
Hilbert Spectrum • Can we produce TF-representation plots based on the IF, IA estimates? • Hilbert Spectrum: IA and IF are combined in order to form a spectrogram-like plot, H(t,f). • Specifically, for any time instant t, H(t,f)=α(t) if IF(t) equals to f and zero at the rest of the frequencies. • In practice, a Time – Frequency grid is adopted in order to construct H(t,f).
On Instantaneous Frequency(Monocomponent signals) • In the case of monocomponent signals, IF coincides with the actual frequency of the signal.
Instantaneous Frequency Multicomponent signals • IF is a non-symmetric oscillation exhibiting spikes that point toward the component with the larger amplitude. • The strength of the IF oscillations (that is the height of the spikes) depends on the relative amplitudes of the components. • Smoothing, , forces IF to “lock” at the component with the higher amplitude
Instantaneous Frequency Multicomponent signals • The further apart in frequency the components are, the larger the amplitude of oscillations become. The frequency of oscillations is relative to the frequency difference.
Beating • When a signal is composed of two components with close instantaneous frequencies, EMD exhibits a beating phenomenon [Rilling and Flandrin (2008)]. • More precisely, if a signal is composed of two harmonics, i.e., f(t) = cos(2πt)+a cos(2πξ0t), RillingandFlandrin [2008] show an interesting zone in the a vs. ξ plane (amplitude vs. frequency plane) where EMD misidentifies the sum of two components as only a single component; the precise shape of this zone depends on the value ξ0. • They also quantified this phenomenon and termed it beating, because EMD “identified” the two harmonics as a single oscillating (i.e., beating) signal.
Time Frequency Reassignment and SSQ • Time-Frequency Reassignment originates from a study of the STFT, which smears the energy of the superimposed Instantaneous Frequencies around their center frequencies in the spectrogram. TFR analysis “reassigns” these energies to sharpen the spectrogram • Synchrosqueezing is a special case of reassignment methods [Auger and Flandrin (1995); Chassande–Mottinet al. (2003,1997)]. • SSQ reallocates the coefficients resulting from a continuous wavelet transform based on the frequency information, to get a concentrated picture over the time-frequency plane, from which the instantaneous frequencies are then extracted • It is adaptive to the signal; • Reconstruction of the signal from the reallocated coefficients is feasible • Solid Theoretical foundations
SynchroSqueezing • Idea from Daubechies & Maes 1996 • Concentrate (squeeze) wavelet coefficients, at fixed times, on the basis of local frequency estimation (synchronised) • Guarantees a sharply localised representation • Allows for reconstruction of identified modes • Offers a mathematical tractable alternative to EMD
Synchrosqueezing – Reconstruction Approach We are interested in the retrieval of the components fkof a multicomponent signal f defined by: The problem can be viewed from two perspectives. The first consists of computing an approximation of the modes, either by using EMD or via wavelet projections. The second uses the SST to reallocate the WT before proceeding with multicomponent retrieval
Underlying theory First recall some results first proposed by Daubechies et al 2011. For a signal defined as a superposition of intrinsic-mode-type functions (IMT):
Underlying theory Where d is a separation condition.
Theorem – A Remark • Component retrieval using the SST is thus first based on the computation of the synchrosqueezing operator and then on its integration in the vicinity of curves defined by ..
Retrieval of Multiple Components (RCM):Practical Implemetation (Brevdo et al 2011) The strategy developed by Brevdo et al for the RCM is to proceed on a component by component basis. The idea is to find a curve ,in the time-frequency plane such that it maximizes the energy which forces the modes to be smooth through a total variation term penalization and is obtained by computing the following quantity:
SST Parameters - WT of Pure Harmonic Signals When dealing with a signal made of pure harmonics The separation of the components using the WT is equivalent to the support of the WT of each component being disjoint that is for all k>1 : Finally, using the definition of the separation condition introduced in Definition 2, when there is no interference between the components and
SST Parameters - WT of an ε-IMT Let f(t) be a mode as defined in Definition 2, then the WT of f is now approximated by: the approximation error being controlled by (C1(f)B1+C2(f)B2+(C3(f)B3), (see Brevdo et al 2011), where Ci, 1≤i≤3, does not depend on the wavelet choice, while So, when is high, a low approximation error requires that must be small. One way to ensure this is to impose that has a fast decay or equivalently, that be large.
SST Parameters - WT of a Superposition of ε-IMT For a multi-component signal as defined in Definition 2 we wish to have the following approximation: So, following the study on a single component, a low approximation error requires that be large enough. Then, we also want each component to be well separated from the other components (which is compulsory if we are to use the WT for mode retrieval), that is for each (a,t) the sum above should be reduced to a single term which is true provided that: Taking into account the separation condition (see Definition 2), we can deduce that the above inequality is true as soon as
Related Work It is worth noting that the behavior of the SST was studied in detail by Wu et al 2011 for two tone signals. However, no conclusions can be drawn from the latter regarding modulated signals because the modulation considerably alters the wavelet representation of such signals and consequently the results given by the SST. A very similar study was carried out by Mallat, ([14, p. 102]), but using a mother wavelet which was symmetric and compactly supported in the time domain. In such a case, the second order terms in the approximation would be negligible only if for all k: provided
Observation This second constraint when applied to an -IMT implies that Φk is such that ,provided that , which is true when ,or equivalently . If we assume that both Ak and are bounded below, the quality of the approximation is better if is small when is large. Since one must also have ( where is the frequency bandwidth of the wavelet) to ensure separation of a different component, cannot be taken arbitrarily small. In contrast to the previous approach, the trade-off parameter between separation and localization of the components is now . The size of the frequency support of the mother wavelet plays a fundamental role when dealing with multi-component signals; adjusting this parameter enables us to tune between good separation and good localization of the modes. In the sequel we will use the previous remark regarding the size of the frequency support of the mother wavelet to build a new RCM algorithm.
A New RCM The algorithm aims at identifying the ridge associated with each component from the magnitude of the WT and then reconstructing the components by using the information in the vicinity of the different ridges. It is based on three distinct steps: - first determine adaptively the number of modes - compute an optimal wavelet threshold - use threshold to retrieve the modes. Code at: http://www-ljk.imag.fr/membres/Sylvain.Meignen/recherche/index.html
Automatic detection of the number of modes Since, for a given time t, the scales of interest in the SST are those where is large enough, we aim at detecting the modes using the following sets: The natural expectation is that given tand when γ is appropriately chosen, each element will be associated with a single mode as defined above). Note: The normalization of the wavelet transform we use is necessary to give sense to the above set. We compute an estimate of the number of modes at time t is: The number of modes is defined as:
Wavelet Threshold Once the number of modes is determined, we first consider the sets: and define T0 as the times tassociated with non empty S0(t). A threshold for the WT and tin T0 is then computed as follows:
The Algorithm for Retrieving the Modes We consider for each t in T0 the set Inf-k+1(t), which enables us to retrieve the mode k by applying the following approximation formula: Note that the index of I in the sum comes from the fact that Ik for small kcorresponds to a high frequency component and that in Definition (2) the components are arranged in increasing frequency order. This reconstruction procedure is fully automatic and avoids the need to narrow down the curve searching in the time-scale space before proceeding with the mode retrieval.
Example of a signal made of non-trivial intrinsic mode type signals
Reconstruction as before but using alternative reconstruction formulae
Non Uniform Sampling To adaptively choose non-uniform samples to minimize the interpolation error is a thorny issue. A method inspired by the EMD consists of selecting the extrema of the signal, such that they depend locally on the strength of the oscillations. Another possibility would be to choose equi-spaced sample points over the whole signal duration. Methods 1. Consider non-uniform sample points for the location of the extrema of the high frequency mode given by the RCM proposed and then piecewise cubic Hermite interpolation of f at these points. 2. Follow the same framework as the above, but the sample points being equi-spaced with the same average sampling rate.
Further Work • Strong modulation • Non-uniform sampling • Signals with a piecewise regular TF representation
References E. Brevdo, N. S. Fuckar, G. Thakur, and H.-T. Wu, “The synchrosqueezing algorithm for time-varying spectral analysis: Robust properties and new plaeoclimate applications,” 2011, arXiv preprint ID: 1105.0010. E. Chassande-Mottin, I. Daubechies, F. Auger, and P. Flandrin, “Differential reassignment,” IEEE Signal Process. Lett., vol. 4, no. 10, pp. 293–294, 1997. I. Daubechies, J. Lu, and H.-L. Wu, “Synchrosqueezed wavelet transforms: An empirical mode decomposition-like tool,” Appl. Computat. Harmon. Anal., vol. 20, no. 2, pp. 243–261, 2011. H.-T. Wu, P. Flandrin, and I. Daubechies, “One or two frequencies? The synchrosqueezing answer,” Adv. Adapt. Data Anal., vol. 3, no. 1–2, pp. 29–39, 2011. S. Mallat, A Wavelet Tour on Signal Processing. NewYork:Academic,1998. G. Rilling, P. Flandrin, and P. Goncalves, “On empirical mode decomposition and its algorithms,” in Proc. IEEE-EURASIP Workshop on Nonlin. Signal and Image Process. (NSIP), Grado (I), Jun, 2003.