Download
1 / 52
540 likes | 1.29k Views
Industry & Competitor Analysis. GET 2001 Strategy Notes Series. Industry Analysis. The first set of notes Described the use of supply chains to map industry-market connections and to identify and begin to analyze likely industries and markets.

E N D
Industry & Competitor Analysis GET 2001 Strategy Notes Series
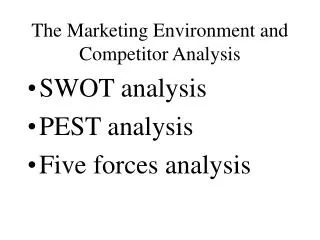
Industry Analysis • The first set of notes • Described the use of supply chains to map industry-market connections and to identify and begin to analyze likely industries and markets. • Introduced the value chain as the more or less integrated collection of activities firms do to transform inputs into outputs -- and value. • And outlined some techniques for describing and analyzing markets. • This set of notes focuses on industries and theories and tools for describing and analyzing them.
The Supply Chain Manufacturing Supply Chain Raw Primary Product Marketer/ Material Manufacturer Fabricator Producer Distributor RetailerExtractor Service Supply Chain Rainmaker Practitioner Contractor
Infrastructure Human Resource Management Technology Development Margin Procurement InboundLogistics OutboundLogistics Marketing/Sales After SalesService Operations Value Chain • The value chain is really a cross-linked network of distinct activities that affect the cost or performance of the others. • Optimizing the links as well as the functions or activities so that the entire chain supports a strategy can yield a powerful, durable, hard-to-duplicate strategic advantage.
Market Analysis: Perceptual Map • Map the key products or services along the dimensions that are most important to the buyers and influencers. Quality Cost
Market/Industry Analysis:Competitors Table • Chart the competitors, noting how they compete.
Industry Analysis • Industries are the circles in the supply chain diagram. • Each industry is a set of firms that operate in the same space in a supply chain, competing to control some of the space and so capture value. • Industries have structure, history/ trajectories and competitive dynamics that set the context for new entrants. • Industries also operate within the macro environment -- where most analysis starts.
Scan the Environment • In business terminology, the environment consists of all the external forces that impinge on the industry, its markets and its firms. • Needless to say, there are a lot of potentially relevant factors. • The following picture summarizes common forces; the following tables list some indicators of these forces.
Environmental Forces Macroenvironment Sociocultural Forces EconomicForces Industry Union/employees Communities Firm/Organization: StructureCultureCompetencies Resources Government Trade Association Stockholders Competitors Creditors Suppliers Political/Legal Forces Technological Forces Customers
Environmental Forces Indicators ECONOMIC TECHNOLOGICAL Total federal spending for R&D Total industry spending for R&D Focus of technological efforts Patent protection New products New technologies New developments in technology transfer from lab to marketplace Productivity improvements through automation GDP trends Interest rates Money supply Inflation rates Unemployment levels Wage/price controls Devaluation/revaluation Energy availability & cost Disposable & discretionary income
Environmental Forces Indicators POLITICAL-LEGAL SOCIOCULTURAL Lifestyle changes Career expectations Consumer activism Rate of family formation Growth rate of population Age distribution of population Regional shifts in population Life expectancies Birth rates Antitrust regulations Environmental protection laws Tax laws Special incentives Foreign trade regulations Attitudes toward foreign companies Laws on hiring and promotion Stability of government
Scan the Environment • The challenge is to sort through the noise to find the key strategic factors for your organization or industry or market. • This requires a constant process of scanning, which is both art and science. • As you conduct various analyses of your industry or markets, keep track of the outside forces that affect them, and especially the trends and discontinuities -- the opportunities and threats -- driven by these forces.
Environmental Analysis Informs All Other Analyses Environmental Analysis Economic, Sociocultural, Technological, Political-Legal Factors Market/Buyer Analysis Competitor Analysis Resource Analysis Supplier Analysis Interest Group Analysis Select STRATEGIC FACTORS ie Opportunities Threats Governmental Analysis
Tool: Matrix for Tracking Environmental Forces Env.Forces Economic Technological Political-Legal Sociocultural Stake-holders 1. 2. 1. 2. 1. 2. 1. 2. Communities Creditors Customers Employees Stockholders Suppliers Etc. Note how each force or set of forces affects each stakeholder group...
Tool: Force Field Analysis Organization Can be done for an organization or an industry. Each arrow is a force, with the lengths indicating relative strength.
Tool: External Strategic Factor Analysis Summary WeightedFactors Weights Rating Score Comments 1 2 3 4 5 Opportunities: Threats: Total Weighed Score: 1.00 Notes: 1. List opportunities and threats (5-10 each) in column 1. 2. Weight each factor from 1.0 (Most Important) to 0.0 (Not Important) in Column 2 based on that factor’s probable impact on the company’s strategic position. The total weights must sum to 1. 3. Rate each factor from 5 (Outstanding) to 1 (Poor) in Column 3 based on the company’s response to that factor. 4. Multiply each factor’s weight times its rating to obtain each factor’s weighted score in Column 4. 5. Use Column 5 (Comments) for rationale used for each factor. 6. Add the weighted scores to obtain the total weighted score for the company in Column 4. This tells how well the company is responding to the strategic factors in its external environment. c
Tool: Industry Scenarios A tool for exploring the impact of major shifts in the underlying context: 1. Examine possible shifts in environmental forces. 2. Identify uncertainties in each of the forces. 3. Identify causal factors behind the uncertainties. 4. Make range of assumptions about each causal factor. 5. Combine assumption into internally consistent scenarios. 6. Analyze the industry situation under each scenario. 7. Determine sources of competitive advantage under each scenario. 8. Predict competitor’s behavior under each scenario.
Industry Structure • Once you understand some of the forces affecting your industry, it is useful to look at the structure of the industry, and especially the power relations that define the interactions within the industry. • Actually, it often works best to start with this industry analysis and then examine how larger trends might shape or change the picture. • The key tool for defining industry structure is Porter’s Five Forces Model -- the one Hamilton presented in detail (see notes in course materials).
Tool: Porter’s Five Forces Model (adjusted) Threat from New Entrants RivalryofFirms Suppliers’ Power Buyers’ Power Threat from Substitutes Power of other Stakeholders
Tool: Porter’s Five Forces Model, (adjusted) • Applying microeconomic theory, Porter highlights the forces that affect a firms ability to raise prices and earn profits. • The stronger a force, the more it limits the industry firms’ ability to set prices. • Thus, strong forces are threats because they are likely to reduce profits; weak forces are opportunities because they may allow firms a chance to earn greater profits. • The pattern of forces shape an industry and constrain firms within the industry -- but industry structure is subject to change as the environment, each force, and each participant’s strategy change.
Tool: Porter’s Five Forces Model, Threat of Entry • Industries that are hard to enter are cozy for insiders, but also often attractive to outsiders longing for the value being shared by so few. • Barriers to entry make it harder for newcomers to play. • Fierce reaction by incumbents. • Size of payoff/relation of supply to demand. • Economies of scale: • minimum efficient scale of production • distribution or sales networks • Pioneering brand advantages. • Experience curve. • Licenses or patents. • Cost of exit.
Tool: Porter’s Five Forces Model, Threat of Substitution • Industries with few substitute products are more attractive than those with many substitutes. • Effective substitutes can often provide ways in for upstarts. • The threat of substitutes is often the weakest of the forces -- except during times of high demand or fast change, when interlopers may see opportunities.
Tool: Porter’s Five Forces Model, Buyer Power • Attractive industries feature disorganized, small customers, with little purchasing and negotiating power. • Buyers gain power when: • They are large, relative to the seller (superstores). • They are organized (eg., a coop). • It is easy to switch to another supplier (eg., when products are standard). • They could integrate backwards and so take over a supplier.
Tool: Porter’s Five Forces Model, Supplier Power • Attractive industries feature small and disorganized suppliers. • Suppliers gain power when: • They are large, relative to the buyers. (Alcoa). • It is difficult for buyers to switch to competing suppliers. (Custom products, proprietary information). • They pose a credible threat of integrating forward and taking over the buyers’ functions.
Tool: Porter’s Five Forces Model, Industry Rivalry • Attractive industries are controlled by monopolies or gentlemanly oligopolies. • On the other hand, the more the players, and the more equally matched, the closer the industry approximates “perfect competition” and minimum profits. • Rivalry is reduced when: • Power is concentrated (C4 Index ) • Competitors can truly differentiate. • It is easy to exit. • Demand is stable and predictable. • Regulation takes the edge off.
Tool: Porter’s Five Forces Model, Other Stakeholders’ Power • Governments (if not in the environmental scan), unions, creditors (if not a supplier), advocacy groups (eg., environmentalists) can all constrain industries. • Regulated industries • Teamsters • Institutional investors • Bottle bills
Industry Dynamics • The weakness of Porter’s model is its static nature. It provides a great snapshot of power relations and is a great tool for focusing research, but may not capture the direction of change in an industry. • Because most industries are dynamic, it is critically important to stay alert to trends -- and more importantly sudden changes of patterns or context (such as new technologies or regulations) -- that might change everything.
Industry Dynamics • At the simplest level, it is important to remember that industries have life cycles. • Newer industries are often fragmented, sellers’ domains with many niches and relatively few constraints. • More mature markets tend to be more consolidated, with more homogenous products, fewer niches, and more intense competition amongst the remaining firms. • Declining industries can be fiercely competitive -- if exit barriers are high -- or more relaxed, if attention is elsewhere.
Industry Dynamics • But increasing numbers of industries evolve and change so quickly, that a life cycle analysis can be misleading. • Theorists like D’Aveni have labeled fast-moving industries with unstable technological foundations hypercompetitive. • In hypercompetitive industries, everything speeds up, companies compete on many fronts at once and leapfrog each other in a breathless race towards an ever-receding goal.
Industry Dynamics • In hypercompetitive environments: • Advantages erode constantly. • Driving firms to risk huge new investments -- eg., betting the firm on a new information technology or chip design. • Or pushing firms to shift competition from competitive arena to competitive arena -- first trying to improve quality, then trying to build deep pockets, to buy experience, etc. • In the end, as the such industries descend into the world of perfect competition, only deep pockets survive....
Tool: Four Arena Analysis • One tool for studying trends and looking for discontinuities is D’Aveni’s Four-Arena Analysis. • He argues that firms can compete in four arenas -- cost/quality; timing/know-how; barriers to entry; and deep pockets -- • And that competition in each arena escalates up a ladder of intensity until competitors fall out, or shift arenas.
Tool: Four Arena Analysis • Thus the analysis consists of: • identifying which arenas are hot; • tracing the ladder of escalation; • trying to predict when the competition might shift into a new arena; • trying to predict the next hot arena. • An obvious strategy for a new entrant is to stake out a new arena of competition before the established players move.
Tool: Four Arena Analysis • Barriers to Entry • Knowledge, capital barriers, etc (often built with timing & know-how) • Patents & other legal walls. • Distribution agreements or patterns. • The competitive landscape. • Deep Pockets • Brawn often overcomes position and brains and speed. • Cost & Quality • Cost leadership vs differentiation • Timing & Know-how • First mover advantages vs fast-follower advantages • Experience Curve
Case: Four-Arena Analysis of the Uniform Services Industry • Rental of uniforms, rags, mats. • Blue collar origins. • From auto repair shops to corporate logos. • Dispersed but consolidating. • Due to government regulation and technological change. • Players: • Cintas, Aramark, Unitog, Unifirst, G&K, many others.
Case: Four-Arena Analysis of the Uniform Services Industry • Some high points: • 1977 - Splash! Aramark Enters • And shakes up a sleepy industry. • 1986 - Slosh! Uncle Sam Wades In • With the Clean Water Act, making Deep Pockets essential. • 1992 - Gasp! Recession & the Clean Air Act • Accelerate consolidation. • Whewie! 30 Years of High Margins • For the survivors.
Case: Four-Arena Analysis of the Uniform Services Industry • Each color is a strategic move (purchases, new plants, new routing systems...) in a given arena. • Cintas’ 50 moves, mostly in Cost-Quality & Timing-Know-how, set the pace; Aramark’s 25 moves provided the drama; G&K was surprisingly aggressive.
Case: Four-Arena Analysis of the Uniform Services Industry • This tracks change in the Timing-Know-how arena. • Each color is an type of innovation, in logistics or plant design or service. • Note the decreasing amount of time it takes for imitation or replication. It’s time to shift arenas.
Case: Four-Arena Analysis of the Uniform Services Industry • This tracks change in the deep-pockets arena. For a variety of reasons, the industry was consolidating. • Despite its lead in other arenas, and its 55 small purchases, Cintas was being outclassed by Aramark’s 7 huge purchases of market share and know-how. Who will be bought next?
Case: Four-Arena Analysis of the Uniform Services Industry • Conclusions: • There were some geographical, market-segment and service-based strongholds • But all were eroding as the industry consolidated and know-how was developed or bought. • Still, the strongest three or four had built formidable barriers to entry, mostly in the form of layers of advantage in know-how and service and operations. • Which meant very high stakes -- $70 million per year in capital expenditures just to stay in the game. • Forcing new entrants to partner with one of the big few, or shift the rules of the game dramatically.
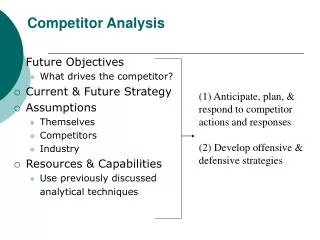
Competitor Analysis • The competitor table introduced in the last set of notes is a good place to start a competitor analysis. • The table simply summarizes the main players and their central modes of competing (or their strengths and weaknesses, or other important dimensions).
Competitor Analysis: Strategic Groups • Sometimes it is useful to subdivide industries into strategic groups -- ie., groups of firms that pursue similar strategies with similar resources. ChiChi’s, Olive Garden, Red Lobster Country Kitchen, Denny’s, Diners, Shoney’s Price Arby’s, Burger King, Domino’s, Hardees, McDonalds, Taco Bell, Wendy’s Selection
Dynamic Competitor Analysis • While useful, the competitor table and the strategic groups are, like Porter’s Analysis, essentially static. • Just as the Four-Arena Analysis is useful for using history to make guesses about the future -- especially about how trends might stop and the ground might shift -- • Hamilton et al’s Core Competency Strategic Intent matrix is useful for tracing -- and predicting -- shifts in competitors’ relative power.
Tool: CCSI Matrix • The CCSI matrix works like a flip-book to bring inter-firm dynamics alive. • Matrices are made at regular intervals • Yearly or quarterly depending on how fast things are changing • The two dimensions of the matrix are: • Core Competency: firms’ relative capacity -- as measured by Tobin’s Q or market/book value or defect rates or as rated by industry experts. • Strategic Intent: firms’ relative aggressiveness -- as measured by R&D expenditures or capital investments or analysis of press releases.
High Average Core Capabilities Low Passive Average Aggressive Strategic Intent Tool: CCSI Matrix
Tool: CCSI Matrix • Each competitor is mapped as a circle: • the size of which reflects sales or capitalization or assets • and the pie slice in which reflects free cash or other available resources
Case: CCSI Analysis of the early 90s Automobile Industry • Flip the through the following three slides fast, noting: • The decline of Honda & Toyota • The ascendancy of Ford • General Motors unsucessful run at leadership • Chrysler’s repositioning as an up and coming star.
High Low .88 .92 .96 1.04 1.08 1.12 Automobile Industry 1990 Toyota 1.5 Honda 1.0 .5 General Motors Core Capabilities Chrysler Ford (.50) (1.0) (1.5) Passive Aggressive Strategic Intent Figure 5
Toyota High 1.5 Honda 1.0 .5 (.50) (1.0) (1.5) Low .88 .92 .96 1.04 1.08 1.12 Passive Aggressive Automobile Industry 1991 Core Capabilities Chrysler General Motors Ford Strategic Intent Figure 6
High Toyota 1.5 Honda 1.0 .5 Ford General Motors Chrysler (.50) (1.0) (1.5) Low .88 .92 .96 1.04 1.08 1.12 Passive Aggressive Automobile Industry 1992 Core Capabilities Strategic Intent Figure 7
From Analysis to Strategy • Most of these analytic tools support different approaches to strategy. • The next set of notes will begin to discuss strategy: The process of pursuing the organization’s mission -- while managing the relationship of the organization to its environment.