Download
1 / 21
210 likes | 307 Views
Clean Air California’s Success -- and Future Challenges. Historical Slide: Smoking Smoke Stacks Speaking Notes: Air Pollution is not new. Natural (non-human) Volcanoes, lightening made fires, Emissions from vegetation and animals Non-Natural (human)

E N D
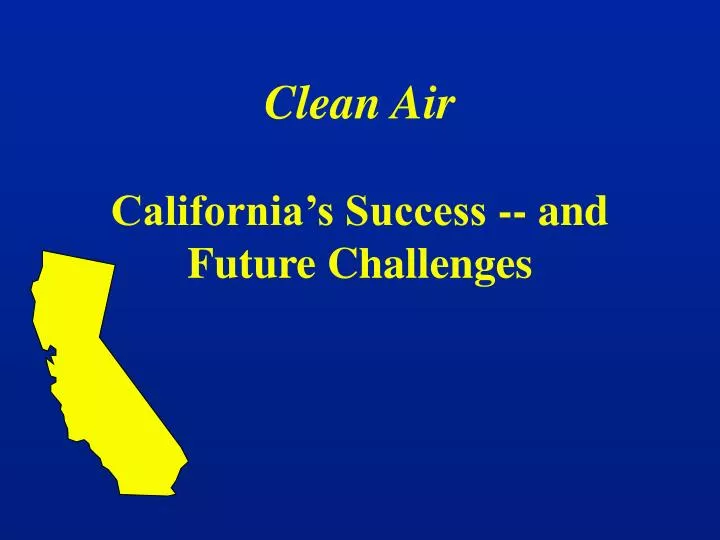
Clean Air California’s Success -- and Future Challenges
Historical Slide: Smoking Smoke Stacks Speaking Notes: Air Pollution is not new • Natural (non-human) • Volcanoes, lightening made fires, • Emissions from vegetation and animals • Non-Natural (human) • Fires used for cooking, heating and agriculture • Fuel switch to Coal (19th Century) • Industrial Emissions • Motor Vehicles • First Control • England’s Edward the First - 1273 • Smoke Nuisance - 19th Century • Smoke Control Ordinances - 1881
Historical Slide: Temperature Inversion Layer Over LA Speaking Notes: Pollutants from Industrialization Historical Events 1930 - Meuse Valley, Belgium 60 dead and thousands sick 1943 - Los Angeles, CA Visibility 3 Blocks. Numerous complaints watery eyes, nausea & respiratory discomfort 1948 - Donora, PA 20 people & 1000’s animals dead, 6000 ill 1952 - London, England Killer Fog: 4,000 Dead
Historical Slide: LA 1943 Young Women with Watery Eyes Speaking Notes: California’s First Experience WW II: California’s population and industry exploded 1943 - Visibility 3 blocks Numerous complaints of vomiting, respiratory discomfort, stinging eyes Cause: A Butadiene Plant? No, problem continued when shut-down
Historical Slide: News headline from 6/10/47 Speaking Notes: Air Pollution Control Act • Signed by Governor Earl Warren June 10, 1947 • Authorized the creation of air pollution control • district in every county: • Los Angeles County APCD - 1947 • Bay Area AQMD - 1955 (first multi-county)
Historical Slide: Dr. Haagen-Smith Speaking Notes: Arie Haagen-Smit 1949: Professor of Biochemistry California Institute of Technology 1952: Discovers mechanism which creates eye irritant pollutant, ozone 1968: First Air Resources Board Chairman 1973: Haagen-Smit Laboratory World renown motor vehicle testing lab
Historical Slide: Meeting with Gas Masks Speaking Notes: Significant Legislative Events 1947 - Air Pollution Control Act signed by Governor Earl Warren 1959 - Legislation established the ability for CA to develop ambient air standards and controls for motor vehicles 1961 - First automotive emission control technology requirements 1963 - First Federal Clean Air Act 1967 - Governor Reagan establishes the Air Resources Board to coordinate all state’s air pollution activities 1969 - First CA Ambient Air Quality Standards
Historical Slide: Crowded Freeway Speaking Notes: The 50’s and 60’s Increase of Environmental Awareness Legislative Framework Focus on Smoke or Particulate Matter Control AND, Shift from electric transit to AUTOMOBILE USE!
Historical Slide: Earth Day Activists Speaking Notes: The 70’s and 80’s Environmental Activism Promotes Legislation 1970: Federal Clean Air Act 1977: Federal Clean Air Act Revision 1987: California Clean Air Act 1990: Federal Clean Air Act
The SIP • A plan to reduce emissions -- lists all • the pollution control measures needed to meet air quality goals • Developed with all stakeholders • Based on technology, • emission reductions achievable, • and cost effectiveness
Picture Slide: Air Resources Board Chairman Alan C. Lloyd, Ph.D. and Board Members Speaking Notes: Decisions and Regulations are developed locally and at the state level in a public stakeholder-participation process
Air Programs ARB:Motor Vehicle Fuels and Technology Cleaner Burning Gasoline and Diesel Vehicle Emission Standards Onboard Diagnostics Smoking Vehicle Program Offroad Vehicle/Equipment Emission Standards Consumer Products Regulatory Program Airborne Toxic Control Measures and “Hotspots” Program Districts: Stationary Source Regulations Point Sources - i.e. Refineries, Chemical Plants Area Sources - i.e. Dry Cleaners, Autobody Shops BAR:Vehicle Inspection and Maintenance - Smog Check
Graphic Slide: Cleanest Air in 30 years Speaking Notes: Since 1940...… • Population increase: 7 million to over 32 million • Added over 24 million cars and trucks to our roads • Vehicle Miles Traveled (VMT) from 24 to 272 billion • CA’s Economy is One of the World’s Largest Since 1970...… • Emissions dropped from 1.6 million tons per day to 1.4 (1990) • In SC Air Basin, Last Stage 3 alert in 1974, Stage 2 alert 1988 How? Clean Air Programs That Work!
New Emission Reductions Needed (% Reduction in Attainment Year)
1994 Ozone SIP Key Elements Stationary Source Controls Consumer Products Pesticides Mobile Source Controls Enhanced Vehicle Inspection and Maintenance Program
Mobile Source Reductions on the Horizon SIP Elements Passenger Cars and Trucks Heavy-duty Trucks Off Road Equipment National Transportation Sources (trains, planes, ships) New Measures Motorcycles Pleasure craft Gas Can Spillage
Mobile Source Reductions on the Horizon SIP Elements Passenger Cars and Trucks Heavy-duty Trucks Off Road Equipment National Transportation Sources (trains, planes, ships) New Measures Motorcycles Pleasure craft Gas Can Spillage
Our Personal Contribution to SmogWhat Can I do? 271 Billion Vehicle Miles Traveled per Year 1249 Tons of Emissions/Day from Vehicle Use 298 Tons VOCs from Consumer Products per day
Our Personal Contribution to SmogWhat Can I do? 271 Billion Vehicle Miles Traveled per Year 1249 Tons of Emissions/Day from Vehicle Use 298 Tons VOCs from Consumer Products per day
900 800 700 600 500 400 300 200 100 Gross Polluter 0 Average Emissions 66-67 68-70 71-74 75-80 81-83 84-86 93+ 87-92 Year Comparison Between Average Vehicles and Gross Polluters 1000 Emissions in PPM Smog Check Advisory
Challenges for the Future Stay the course! Don’t lose the gains we’ve made - - Personal choices! Part of the challenge and the solution ... for Clean Air!