Download
1 / 23
230 likes | 381 Views
Mars/moon impact rate ratio: 2000/2012 comparison. Boris Ivanov Institute for Dynamics of Geospheres, RAS, Moscow. Impact craters as a link to other terrestrial planets, satellites and asteroids Interplanetary comparisons Mars/Moon impact ratio . ASTEROIDS. Stony (several types) Iron

E N D
Mars/moon impact rate ratio:2000/2012 comparison Boris Ivanov Institute for Dynamics of Geospheres, RAS, Moscow • Impact craters as a link to other terrestrial planets, satellites and asteroids • Interplanetary comparisons • Mars/Moon impact ratio 3MS3 IKI 2012
ASTEROIDS • Stony (several types) • Iron • Orbit evolution due to close encounters and resonances with giant planets • No close encounters with Jupiter (Tisserand T_J>3) 3MS3 IKI 2012
COMETS • Jupiter family (JFC): mostly from Kuiper Belt • 2<T_J <3 • Long-periodic comets (LPC) drop out of Oort cloud • Unpredictable (number of returns?) 3MS3 IKI 2012
Crater chronology: interplanetary comparison Moon: crater counts and chronology by returned samples Moon crossers orbits - > impact velocity and probability Scaling laws: D_crater -> D_projectile Bolide ratio Rb Of numbers of impacts of the same size bodies per 1 km2 per 1 year Mars crossers orbits - > impact velocity and probability, relative number of projectiles Scaling laws: D_projectile -> D_crater Mars: crater counts (beware of secondaries!) Mars: model chronology 3MS3 IKI 2012
2012 astorb.dat • the percentage of comet-like orbits (higher impact velocities) on the Moon is about 25% to 20%, on Mars this number is factor of ~2 less; • (2) at the modern Mars orbit (e=0.094) the “bolide ratio” (the ratio of impact number per unit area per unit time) is about Rb=5.5 in comparison with 2000 estimates of Rb=4.9 • (3) the average impact velocity for asteroid-like objects on the moon increases to ~19 km/s in comparison with 16.1 km/s in 2000 estimates. 3MS3 IKI 2012
Population of asteroid-like (TJ>3) and comet-like orbits (TJ<3)2005 vs. bolide survey Below D~1 km (H~18) population of small (10 cm) projectiles the share of comet-like bodies may increase factor of 2 3MS3 IKI 2012
Öpik-Wetherlill impact probabilities for osculating orbits 2000 Planet 4= the moon Number of bodies 58709 H_max= 18.050000 Number of impactors 160 Mean intrinsic probability = = 1.865368E-10 1/Proj <v_imp> 16.122780 <v_inf> 15.916600 ------------------------------------- Planet 5=Mars Number of bodies 1109 Number of impactors 1109 Mean intrinsic probability = 2.587355E-10 1/Proj <v_imp> 9.929664 <v_inf> 8.330708 2012 Planet 4= the moon H.ge. 18. arc_limit 20 Number of bodies 458 Average of impactors 458 Intrinsic probability = 1.58944954E-10 per body <v_imp> 17.0044266 <v_inf> 16.8058947 -------------------------------- Planet 5=Mars H.ge. 18. arc_limit 20 Number of bodies 5774 Average of impactors 5774 Intrinsic probability = 2.29726429E-10 per body <v_imp> 9.30803356 <v_inf> 7.60588575 3MS3 IKI 2012
2012 astorb.dat, Mars- and Moon-cossers number vs. magnitude (H=18 approximately corresponds to Dproj ~ 1 km In the current epoch number of Mars-crossers with asteroid like orbits is factor of 20 larger than the number of Moon-crossers. Number of bodies with comet-like orbits is factor of 5 larger for Mars. 3MS3 IKI 2012
From craters to projectiles • Scaling laws for impact cratering allow us to convert size-frequency distribution of craters to the size-frequency distribution of projectiles • Crater-derived curves may be compared with astronomical observations 3MS3 IKI 2012
Ivanov, B., Size-Frequency Distribution of Asteroids and Impact Craters: Estimates of Impact Rate, in Catastrophic Events Caused by Cosmic Objects, edited by V. V. Adushkin and I. V. Nemchinov, pp. 91-116, Springer, 2008. Scaling laws for impact cratering Coupling parameter: Transient cavity scaling: (1 + 2) Crater collapse: (3) 3MS3 IKI 2012
Modeling of impact melt in large terrestrial crater confirm validity of scaling laws for D_crater > 1km 3MS3 IKI 2012
2008 iteration of the scaling law for small (<1-10 km) lunar craters Blind usage of “standard” scaling laws results in a factor of 6 difference in the R(D_crater) for the same projectile. Looks strange... 3MS3 IKI 2012
2010-2012 – hydrocode with porosity and dry friction + Demonstration of dry friction importance - Modeling velocity <12 km/c 3MS3 IKI 2012
2012 (Ivanov, LPSC): more realistic dry friction in fragmented rocks with thermal softening under shock/deformational heating • If so (need to be verified more) then • “Porous target” scaling is wrong while extrapolated beyond 7 km/s. • “Shallow” pi_V vs. pi_2 scaling is mostly due to dry friction, not due to material porosity only. • Scaling of “regolith” lunar craters should be redone. • How porous is Martian upper layer important for 5-50 m in diameter craters (real impact rate available)???. 3MS3 IKI 2012
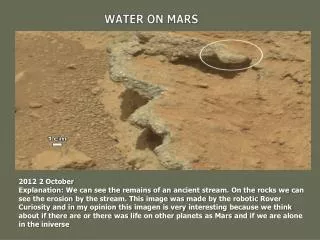
To date around 200 “new” impact cites (impact craters and crater clusters) are found with well bounded formation time HIRISE modern impact rate The recent data based on the discovery rate based solely on CTX/CTX image comparison (with crater size improved with HiRISE images, 44 impacts) gives factor of 2 to 3 lower cratering rate in the upper diameter bins (Daubar et al, 2012, under revision) “All” craters gives better fit to Hartmann-Neukum chronology 3MS3 IKI 2012
Conclusions • We are close to update the 2000 Mars/moon cratering rate ratio… but not ready yet. • Pure updating of planetary-crosser’s orbit list of crossers does not change the Mars/moon impact ratio dramatically (despite ~6-fold increase in the number of known objects). • Future discussion should include possible difference in crater-forming projectile properties. Small crater clusters found on Mars witness in favor of the presence of 10% to 20% low density (high porosity?) projectiles. • Two additional questions: (1) the difference in mechanical properties of regolith on the dry Moon and possibly ice-saturated Martian soil, and (2) the efficiency of lunar impacts of low-density objects assumed from Martian strewn fields. • New observational data demands new supportive research and modeling. 3MS3 IKI 2012
Asteroids, Trojan, and JF comets • Cumulative plot for Main Belt, Trojan asteroids, and Jupiter Family comets in comparison with cumulative N>D distribution derived for crater forming projectiles (thick curves). 3MS3 IKI 2012
Asteroids, Trojan, and JF comets (2) • R-plot for Main Belt asteroids according to Davis et al. (1994) and Spacewatch data by Jedicke and Metcalfe (1998) for all the Main Belt and the inner belt in comparison with the SFD for projectiles formed lunar craters. Trojans are after Jewitt et al. (2000), comets - after Tankredy et al. (2000). 3MS3 IKI 2012
RECENT DATA • Sloan Digital Sky Survey (SDSS): Ivezic et al, 2001 • LINEAR: Stuart, 2001 3MS3 IKI 2012
Physical mechanism of „SFD waves:CRITICAL SPECIFIC ENERGY(Love&Ahrens, 96; Melosh&Ryan,97) 3MS3 IKI 2012
Near-Earth bodies (2) • The lunar “projectile curve fitted to N(1)=800 in comparison with bolide data. Letters “T” designate the possible range of Tunguska scale projectiles. 3MS3 IKI 2012
Crater size-frequency distribution:cumulative, increment, relative (R) Incremental Relative (R-plot) 3MS3 IKI 2012
Crater size-frequency distribution:cumulative, increment, relative (R) Cumulative Relative (R-plot) 3MS3 IKI 2012