Download
1 / 11
110 likes | 276 Views
Supplementary Figure 1. Correlation between the expression of C11orf53, C11orf92 and C11orf93. a. b. c. R adj : Pearson partial correlation coefficient adjusted for tissue type R T : Pearson correlation coefficient for Tumors R N : Pearson correlation coefficient for Adjacent mucosa

E N D
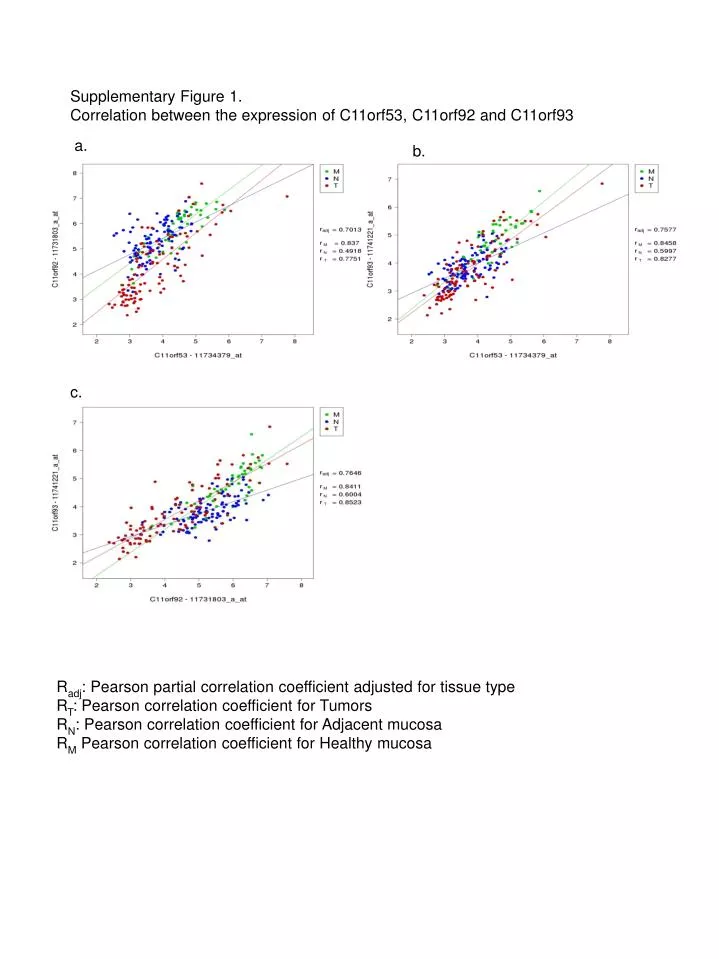
Supplementary Figure 1. Correlation between the expression of C11orf53, C11orf92 and C11orf93 a. b. c. Radj: Pearson partial correlation coefficient adjusted for tissue type RT: Pearson correlation coefficient for Tumors RN: Pearson correlation coefficient for Adjacent mucosa RM Pearson correlation coefficient for Healthy mucosa
Supplementary Figure 2. Association of rs7130173 with the expression of C11orf53, C11orf92, and C11orf93. Supplementary Figure 3. Genotype combinations for rs7130173 and rs380842 with the expression of C11orf53.
Supplementary Figure 4. Genotype combinations for rs7136702 and rs11169552 with the expression of DIP2B.
Supplementary Figure 5. Association of rs61927768 with the expression of DIP2B Supplementary Figure 6. Genotype combinations for rs61927768 and rs7136702 with the expression of DIP2B
SupplementaryFigure 7. Bindingmotif of SP1 analyzedwithTransfac in the rs61927768 region, and correlation of theexpression of DIP2B with SP1.
Supplementary Figure 8. Correlation of the expression between SHROOM2 and GPR143 Radj: Pearson partial correlation coefficient adjusted for tissue type RT: Pearson correlation coefficient for Tumors RN: Pearson correlation coefficient for Adjacent mucosa RM Pearson correlation coefficient for Healthy mucosa
Supplementary Figure 9. Association of genotypecombinationsfor rs957490 and rs5934683 withtheexpression of SHROOM2.
Supplementary Figure 10. Associations of tumor expression and genotype for most significant SNPs
Supplementary Figure 11. Protein-Protein Interaction Network retrieved for trans-eQTL genes for locus 11q23.1 • Interacting protein • Seed protein (cis) • Seed protein (trans) Supplementary Figure 12. Protein-Protein Interaction Network retrieved for trans-eQTL genes for locus 12q13.12 • Interacting protein • Seed protein (cis) • Seed protein (trans)
Supplementary Figure 13. Map of histone modifications for rs7130173 in 11q23.1 from ENCODE.
Supplementary Figure 14. Map of histone modifications for rs6192776 in 12q13.12 from ENCODE.