Download
1 / 37
370 likes | 505 Views
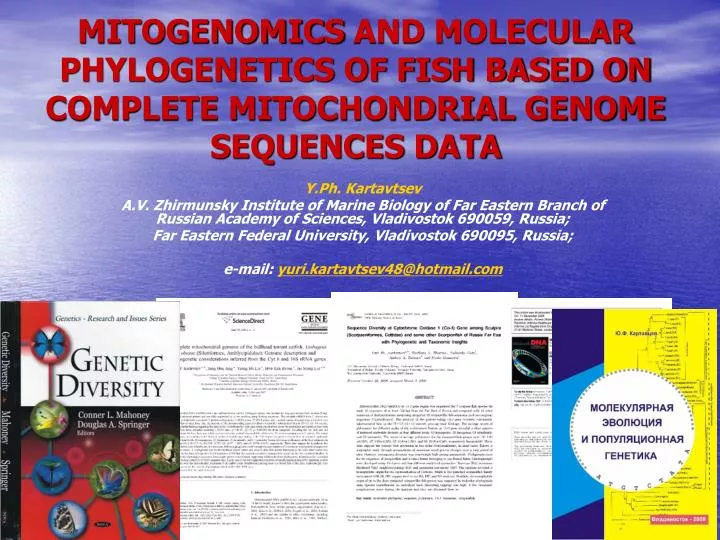
MITOGENOMICS AND MOLECULAR PHYLOGENETICS OF FISH BASED ON COMPLETE MITOCHONDRIAL GENOME SEQUENCES DATA. Y.Ph. Kartavtsev A.V. Zhirmunsky Institute of Marine Biology of Far Eastern Branch of Russian Academy of Sciences, Vladivostok 690059, Russia;

E N D
MITOGENOMICS AND MOLECULAR PHYLOGENETICS OF FISH BASED ON COMPLETE MITOCHONDRIAL GENOME SEQUENCES DATA Y.Ph. Kartavtsev A.V. Zhirmunsky Institute of Marine Biology of Far Eastern Branch of Russian Academy of Sciences, Vladivostok 690059, Russia; Far Eastern Federal University, Vladivostok 690095, Russia; e-mail: yuri.kartavtsev48@hotmail.com
1. Comparative Mitogenomics: Introduction. 2. The Review of Literature Data on p- Distances. 3. Molecular Phylogenetics & DNA Barcoding. MAIN GOALS
1. COMPARATIVE MITOGENOMICS: INTRODUCTION (1) • Mitochondrion DNA (mtDNA) is a ring moleculeof 16-18 kilo-base pairs (kbp) in length. As literature data show, mtDNA of all fisheshas similar organization (Lee et al., 2001; Kim et al., 2004; Kim et al., 2005; Nagase et al., 2005; Nohara et al., 2005) andsmall differencesamong all vertebrate animals, including men (Anderson et al., 1981; Bibb et al., 1981; Wallace, 1992; Kogelnik et al., 2005). • The complete content of whole mitochondrial genome (mitogenome) includes: control region (CRorD loop), where the siteof initiation of replication and promoters are located, big (16S) and small (12S) rRNA subunits, 22 tRNAand 13polypeptide genes, total N=37.
Fig. 1.1. a. Summary for the ANOVA two variable analysis: the plot of frequency distribution for the four nucleotides in torrent catfish, Liobagrus obesus. The difference between ND6 and 12 other protein genes nucleotide composition is illustrated. The total frequencies are shown for all 3 nucleotide positions in codons. Significance is shown on the top of the graph b. Plot of the average percentage at four nucleotides of flatfish species, order Pleuronectiformes (Groups 1-2) in comparison with representatives of Perciformes (3). Original data were taken from Table 2 for the Cyt-b gene at all three nucleotide positions. On the top results of one-factor MANOVA are given. Groups 1 to 3: 1 – Species from this study; 2 – Species taken from GenBank; 3 – GenBank data on Perciformes (From: Kartavtsev et al., 2007a, 2007b, Gene and Marine Biology). 1. COMPARATIVE MITOGENOMICS: INTRODUCTION (2) a b
1. COMPARATIVE MITOGENOMICS: INTRODUCTION (3) Fig. 1.2. The control region (CR, 814 bp after alignment) and conserved sequences for the bullhead torrent catfish, Liobagrus obesus in comparison with three other catfish species. Aligned sequence features and conserved blocks are shown: TAS – strikeover letters, TATA-box – underlined letters, CSB1 – gray box, CSB2 – frame, and SCB3 – double frame (From: Kartavtsev et al., 2007a).
1. COMPARATIVE MITOGENOMICS: INTRODUCTION (5) WHAT IS MAIN OUTCOME • Mitogenome in vertebrates is very conservative (~16 KB long). In invertebrates it is much longer, up to 27-300 KB. • Most conservative is gene order. • Still, there are flexible sections. • Unknown are nuclear vs. mitogenome exchange and interaction. • Many genes that known to be mitochondrial (Idh*, Mdh* etc.) are absent in mtDNA. Contrary to that, some mtDNA genes (Cyt-b, Co-c) are active in nuclear background. • There are mutations in mtDNA that create human deceases. • Some mobile elements might be present in mitogenome. IS sections detected.
PHYLOGENETICS & DNA BARCODING MARKERS • Usually in phylogenetic research single gene sequences are usedfor both mtDNA and nuclear genome. However, recently more and more frequent are become complete mitogenome usage. • Most popular in phylogenetics are sequences ofcytochrome b(Cyt-b) and cytochromeoxidase 1 (Cо-1) genes, which used for taxa comparison at the species - familylevel (Johns, Avise, 1998; Hebert et al., 2004; Kartavtsev, Lee, 2006; Kartavtsev, 2009). Many sequences that bringing the phylogenetic signal obtainedfor different taxaat gene 16S rRNA as well. • Sequences ofseparate genes can have different phylogeneticsignal because of differences in substitution rates. This is also true for different sections of genes.Also, under comparison of higher taxa there may be effects of homoplasy. When numerous taxa available there are problemsof insufficient information capacity of sequences to cover big species diversity and adequate taxa representation is quite important (Hilish et al., 1996). Nevertheless, for the species identification, excluding rare cases, fine results are availableeven with the usage of short target sequences, like Со-1,with 650bp.
Applicability of Different DNA Typesin Phylogenetics and Taxonomy Spacers [ITS-1, 2] mtDNA nDNA, rDNA SpeciesGenusFamilyOrderClassPhylum Most substantiated statistically results Statistically significant results
3.1.DIVERSITY AT DNA MARKERS WITHIN SPECIES AND IN TAXA OF DIFFERENT RANK. AN ANALYSIS OF EMPIRICAL DATA 2. THE REVIEW OF LITERATURE DATA ON P- DISTANCES
2.1. USING P-DISTANCES. SUMMARY • To estimate the actual number of substitutions among sequences XandY it is necessary to introduce a certain mathematical model. • At least 8 major models (Nei, Kumar, 2000; Felsenstein, 2004) and 56 in total are referred in sources nowadays (Posada, 2005; http://darwin.uvigo.es/software/modeltest.html). • Among most simple and known are Jukes, Cantor (1968; JC) and Kimura (1980) two parametric (K2P) models. The late is default in some packages (e.g. PAUP). These models consequently suggest the equality of all kinds of substitutions and non equality for transitions (α) and transversions (β). • Titles of some other models: Equal-input, Tamura, HKY (Hasigawa-Kishino-Yano),Tamura-Nei(TrN), Generaltimereversible(GTR), Unrestricted.
2.2. USING P-DISTANCES. SUMMARY • In the K2P model equilibrium frequencies of 4 nucleotides are 0.25. However, the algorithms suggested for calculations (expected p^ and its variance) here and in Jukes-Cantor model are applicable irrelevant to frequency deviations (Rzhetsky, Nei, 1995). Thus, both models are suitable for wider range of conditions, where real parameters stay unknown. • Be unconfused we should remember that in Kimura’s model ratio of transitions to transversions isR = α / 2β, however many authors and many software using different proportion- k = α / β. • In our estimates (Kartavtsev, Lee, 2006) most authors using K2P (29%) and many using simple p^ or such measures as HKY, TrN etc. To choose an appropriate model there is a popular program MODELTEST(Posada, Grandal, 1998). Very useful info on model properties and their applicability over wide range of specific data sets may be find in literature (Nei, Kumar, 2000; Hall, 2001; Sanderson, Shaffer, 2002; Felsenstein, 2004).
2.3. P-DISTANCE. SUMMARY • p-Distance and others. p-distance is a fraction of different nucleotides in their total number for a pair of sequences. • Numerical simulations showed that when p-distances are small, <20%, then any model give similar values of divergence (Fig. 1.1). • Because of heterogeneity of substitution rates along sequences and different parts of genes an important correction of p-distance is gamma-correction (e.g. Nei, Kumar, 2000; Felsenstein, 2004). Fig. 2.1.Estimates of the number of nucleotide substitutions obtained by different distances measures when actual numbers follows TrN-model (From Nei, Kumar, 2000).
Intraspecies diversity There are many and variable estimates based on different markers. For instance, two copepod species obtained nucleotide diversity (π) dependent on latitude at rRNA gene of mtDNA. Subarctic species Calanus finmarchicus,π=0.37%,SD = 0.26,was less variable, than temperate water, Nanocalanus minor, π=0.50%,SD = 0.32 (Bucklin, Wiebe, 1998). If focus on Cyt-b and Co-1 sequence diversity, К2Р value atСо-1at sequence some 600 bp was estimated for 107 intraspecies groups of different species for five families of baterfly (Lepidoptera:Arctidae, Geometridae, Noctuidae, Notodontidae, Sphingidae), as small (Hebert et al., 2002). For average values the variation is within limit: 0.17 – 0.36%.Our recalculation gives average for these groups: К2Р = 0.25 ± 0.04%. • In our data base for hundred intraspeciesр-distancesaverages comprise atCyt-bandCo-1: M=1.55± 0.56% andM=0.55± 0.19%, correspondingly (Kartavtsev, Lee, 2006). • Most important thing that I like to stress here is that for many species a stable, geographically restricted intraspecies gatherings have been detected. They are marked by mtDNA genes and obviously there are isolated intraspecies phylogroups existing for many generations, which as real as real are the local stocks that defined by other biological methods. Number of such examples is summarized by Avise &Wolker(1999) and many also presented in our reviews (Kartavtsev, Lee, 2006, Kartavtsev, 2009). Among others may be mentioned bottle-nose dolphin, Tursiopstruncatus (Dowlin, Brown, 1993), Canadian gees, Brantacanadiensis (VanWagner, Baker, 1990), fishes, FundulusheteroclitusandStizostedionvitreum (Gonzales-Willasefior, Powers, 1990, Billington, Strange, 1990) etc. (Stepien, Faber, 1998).
p-DISTANCES IN GROUPS OF COMPARISON,Review 2 Fig. 2.2. Plot of distribution of weighted mean p-distances among five groups of comparison at Cyt-bandCo-1 genes and 21,000 animal species. Groups here: 1. Intra-species, among individuals of the same species; 2. Intra-sibling species + semispecies + subspecies, 3. Intra-genus, among species of the same genera; 4. Intra-family, among genera of the same family , 5. Intra-oreder, families of the same order(From Kartavtsev, 2011a, Marine Genomics). Thus, data available suggest that in general a phyletic evolution prevail in animal world, and so far, the Geographic speciation events (Type 1a) most common in nature. Do data presented assume that speciation is always follows the Type 1a mode? I guess, no. Few examples below let to support this answer.
DISTANCE VS TAXA SPLITTING • Has punctuation an impact in species origin on molecular level? • Avise, Ayala, 1976; Kartavtsev et al., 1980; current – No. • Pagel et al., 2006 – Yes. rs = 0.22, p < 0.05 Number of Splittings Transformed p-distance Fig. 2.3. Plot of p-distance on number of splittings at Cyt-b sequence data for catfishes and flatfishes
WHAT IS MAIN OUTCOME • Distance measure alone is not satisfactory descriptor and they should be standartized. • Data on intraspecies diversity (heterozygosity) at structural genes are necessary. • Measures of regulatory genome changes should be necessary to describe transformative modes of speciation. • Other descriptors of genomic change are required (e.g. chromoseme number, NF, transcription rate etc.).
4. MOLECULAR PHYLOGENETICS & DNA BARCODING Phylogenetics + Taxonomy Actually # 1: Basic Value. Dating of Splitting. Identification + Taxonomy Historically # 1: Biochemical Systematics. DNA Barcoding
RESULTS (1) Fig. 3.1.Maximum likelihood tree of the unambiguous aligned 14,293 nucleotide positions from 31 species/subspecies of Leuciscinae and 9 outgroup species based on heuristic search with the GTR+I+G model. 1st codon, 2nd codon, 3rd codon, tRNAs, rRNAs were separately analyzed; i.e., partitions were introduced in program settings. Numbers beside internal branches indicate bootstrap probabilities from 1,000 replicates.The scales in the left bottom corners indicate relative branch lengths (From: Imoto et al., 2013, Gene).
RESULTS (2) Fig. 3.2. Posterior distribution of divergence times as estimated among Leuciscinae species and related species. Horizontal bars represent the estimated 95% credibility intervals of divergence times (From: Imoto et al., 2013, Gene).
RESULTS (3) Fig. 3.3.Rooted consensus (50%) BA-tree, which shows molecular phylogenetic interrelationships for 25 mitogenome sequences of 13 structural genes. In the nodes the posterior BA probabilities for n=106 simulated generations and bootstrap support for ML (n=500), MP and NJ (n=1,000 for both) are shown (BA/ML/MP/NJ).BA and ML trees are based on GTR+I+G model. All structural genes used including ND6, no partitions introduced (From: Kartavtsev et al., 2013, in press).
RESULTS (4) Fig. 3.4.Combined phylogram of Co-1 and Cyt-b genes for 59 sequences of our and GenBank representatives of Glyptothorax catfish jointly with 3 outgroup specimens built by BA algorithm. In the nodes the support levels (Probabilities, %) are shown in order: BA, ML, MP, and NJ. Abbreviation 100 x 4 denotes: 100,100,100,100 and 100 x 3 denotes: 100,100,100 (From: Singh et al., 2013, submitted).
RESULTS (4) A B Fig. 3.5.Tanglegram built for Co-1 vs. Cyt-b genes as previously for 59 sequences of our and GenBank representatives of Glyptothorax catfish jointly with 3 outgroup specimens in two approaches depicted at A and B. At A the consensus tree made by LSA algorithm from 2 single gene trees is represented.At B the consensus tree built by BA algorithm from 2 partitions representing sequences of Co-1 plus Cyt-b is visualized. Lines show common tips defined by the heuristic algorithm in PP Dendroscope. The lowest stable ancestor (LSA) technique is used for building consensus tree in A (From: Singh et al., 2013, submitted).
THE INTERNATIONAL iBOL PROJECT • The iBOL&CBOL are main global initiatives. The Fish-BOL, its part, has over 5400 species barcoded by Co-1 from more than 30,000 specimens what makes it unique. P. Hebert and B. Hanner are preparing a $150M grant application for Genome Canada only for 2008. Othernations’ funds in iBOL are also big in some countries and unions: USA, EU. • In this year there will be held 5th world-wide internationalconference (November 2013, China) and many regional meeting were performed.
INTERNATIONAL PROJECT, BARCODING OF LIFE, iBOL (1) • iBOL, CBOL, Fish-BOL.DataBaseis 88444 species and 1039413 DNA-barcodesatCo-1gene (BOLD, 16.11.2010). • Main Aim. The Whole Biodiversity Description. 1 million 700are known now (without bacteria). Supposed number is10 M, i.e. majority are still unknown.
INTERNATIONAL PROJECT, BARCODING OF LIFE, iBOL (2) Co-Chair: P. Hebert и B. Ward
AREA OF INVESTIGATION: START UP РАБОЧАЯ ГРУППА ПО СЕВЕРОВОСТОЧНОЙ АЗИИ North East Asian Regional Working Group Executing Chair: Youn-Ho Lee Co-Chairs: Yuri Kartavtsev T. Shao, Shunpin He, Keiichi Matsuura, Youn-Ho Lee
OUR OWN RESULTS ON FISH 1 2 3 4 Some objects: (1)Opisthocentrus ocellatus, (2)Ammodytes hexapterus306a(Ammodytidae), (3) Mioxocephalus brandtii, (4) Hemitripterus villosus (Cottidae)(Images: 1-2 - O. Rutenko, 4 - A. Sokolovsky).
THANKS FOR ATTENTION! GRANT SUPPORT: FEB RAS 12-I-OBN-07, 12-II-СО-06-017, and KPFI 12-06-002.
SPECIATION MODES (SM): POPULATION GENETIC VIEW • ABSENCE OF QUANTITATIVE THEORY OF SPECIATION (QTS) • We concluded that the speciation theory in evolutionary genetics is absent in exact scientific meaning, which expects the ability to predict future by the theory. In this case this is to predict species origin, or at least discriminate among several speciation modes on the basis of some quantitative parameters or their empirical estimates. Attempts made in this direction (Avise, Wollenberg, 1997, Templeton, 1998) do not fit the above criteria. That is why we attempted to step in the discrimination of the speciation modes on the basis of main population genetic measurements available in literature, and that may be laid in the frame of a genetic speciation concept. • BASEMENT FOR THE QTS • As a basis for the set of evolutionary genetic concepts we used verbal descriptions of speciation modes made by Templeton (1981). As a result the classification scheme for 7 different modes of speciation was created (Fig. 3.3). This approach leads to quite simple experimental scheme that permits: (i) to arrange further investigation of speciation in different groups of organisms, and (ii) to derive analytical relations for each speciation mode (Fig. 3.4). • EMPIRICAL QTS TESTING • The scheme was tested for Cyprinids (Kartavtsev et al., 2002) and explains well our own earlier data on salmons (Kartavtsev, Mamontov, 1983, Kartavtsev et al., 1983). Certainly, both the testing of the scheme presented, and its theoretic background must be further developed.
Fig. 3.6.SPECIATION MODES (SM): POPULATION GENETIC VIEW(From:Kartavtsev, 2011a, Marine Genomics)
Fig. 3.4. ANALITICAL DESCRIPTION OF SEVEN TYPES OF SPECIATION MODES Fig. 11. Analytic representation of seven speciation mode (From Kartavtsev, 2009 with modifications). D1–D3, divergent speciation modes; T1–T4, transformative (transilience) speciation modes. Descriptors: D, genetic distances for structural gene; DT, pT: in putative parental taxon; DS, pS: among conspecific demes; DD, pD: among subspecies or sibling species; HD, D: mean heterozygosity/diversity in putative daughter population; HP, P: mean heterozygosity/diversity in putative parental population; EP: divergence at regulatory genes in putative parental taxon; ED: divergence at regulatory genes in putative daughter taxon; TM+: test for modification (positive); TM–: test for modification (negative).
Summary • Algorithms of nucleotide diversity estimates and other measures of genetic divergence for the two genes Cyt-b (cytochrome b) and Co-1 (cytochrome oxidase 1) are analyzed. Based on the theory and algorithms of distance estimates on DNA sequences, as well as on the observed distance values retrieved from literature, it is recommended for realistic tree building to use a specific nucleotide substitution model from at least 56 available. Using a database of p-distances and similar measures gathered from published sources and GenBank sequences, genetic divergence of populations (1) and taxa of different rank, such as subspecies, semispecies or/and sibling species (2), species within a genus (3), species from different genera within a family (4), and species from separate families within an order (5) have been compared. • Distance data for 20,731 species reveal various and increasing levels of genetic divergence of the sequences of the two genes, Cyt-b and Co-1 (cytochrome b, and cytochrome c oxidase subunit 1), in the five groups compared. Mean unweighted scores of p-distances for five groups are: Cyt-b (1) 1.38±0.30, (2) 5.10±0.91, (3) 10.31±0.93, (4) 17.86±1.36, (5) 26.36±3.88 and Co-1 (1) 0.89±0.16, (2) 3.78±1.18, (3) 11.06±0.53, (4) 16.60±0.69, (5) 20.57±0.40. The estimates show good correspondence with other analyses. • Differences in divergence between the genes themselves at the five hierarchical levels were also found. This conforms to the ample evidence showing different and nonuniform evolution rates of these and other genes and their various regions. The results of the analysis of the nucleotide divergence within species and higher taxa of animals are (1) in a good agreement with previous results and showed the stability of a general trend, and (2) suggest that a phyletic evolution in animals prevails at the molecular level, and speciation mainly corresponds to the geographic mode (type D1) that well fails in a frame of the Biological Species Concept (BSC). The prevalence of the D1 speciation mode and the BSC does not mean that other modes are absent and concepts are invalid. It is shown how we can recognize speciation modes formally with the operational genetic criteria.