Download
1 / 1
10 likes | 157 Views
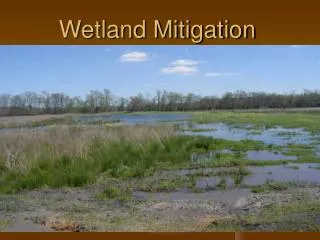
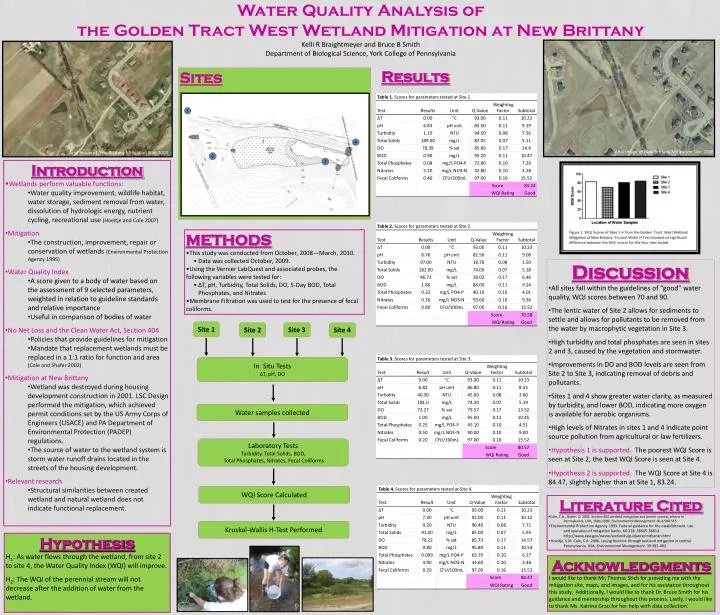
Water Quality Analysis of the Golden Tract West Wetland Mitigation at New Brittany Kelli R Braightmeyer and Bruce B Smith Department of Biological Science, York College of Pennsylvania. 1. 4. 2. 3. Site 4. Site 1. Site 3. Site 2. In Situ Tests ΔT, pH, DO. Water samples collected.

E N D
Water Quality Analysis of the Golden Tract West Wetland Mitigation at New Brittany Kelli R Braightmeyer and Bruce B Smith Department of Biological Science, York College of Pennsylvania 1 4 2 3 Site 4 Site 1 Site 3 Site 2 In Situ Tests ΔT, pH, DO Water samples collected Laboratory Tests Turbidity, Total Solids, BOD, Total Phosphates, Nitrates, Fecal Coliforms WQI Score Calculated Kruskal-Wallis H-Test Performed Results Sites Arial Image of New Brittany Mitigation Site: 2003 Arial Image of New Brittany Mitigation Site: 2008 • Introduction • Wetlands perform valuable functions: • Water quality improvement, wildlife habitat, water storage, sediment removal from water, dissolution of hydrologic energy, nutrient cycling, recreational use (Hoeltje and Cole 2007) • Mitigation • The construction, improvement, repair or conservation of wetlands (Environmental Protection Agency 1995) • Water Quality Index • A score given to a body of water based on the assessment of 9 selected parameters, weighted in relation to guideline standards and relative importance • Useful in comparison of bodies of water • No Net Loss and the Clean Water Act, Section 404 • Policies that provide guidelines for mitigation • Mandate that replacement wetlands must be replaced in a 1:1 ratio for function and area (Cole and Shafer 2002) • Mitigation at New Brittany • Wetland was destroyed during housing development construction in 2001. LSC Design performed the mitigation, which achieved permit conditions set by the US Army Corps of Engineers (USACE) and PA Department of Environmental Protection (PADEP) regulations. • The source of water to the wetland system is storm water runoff drains located in the streets of the housing development. • Relevant research • Structural similarities between created wetland and natural wetland does not indicate functional replacement. • METHODS • This study was conducted from October, 2008—March, 2010. • Data was collected October, 2009. • Using the Vernier LabQuest and associated probes, the following variables were tested for: • ΔT, pH, Turbidity, Total Solids, DO, 5-Day BOD, Total Phosphates, and Nitrates • Membrane Filtration was used to test for the presence of fecal coliforms. • Discussion • All sites fall within the guidelines of “good” water quality, WQI scores between 70 and 90. • The lentic water of Site 2 allows for sediments to settle and allows for pollutants to be removed from the water by macrophytic vegetation in Site 3. • High turbidity and total phosphates are seen in sites 2 and 3, caused by the vegetation and stormwater. • Improvements in DO and BOD levels are seen from Site 2 to Site 3, indicating removal of debris and pollutants. • Sites 1 and 4 show greater water clarity, as measured by turbidity, and lower BOD, indicating more oxygen is available for aerobic organisms. • High levels of Nitrates in sites 1 and 4 indicate point source pollution from agricultural or law fertilizers. • Hypothesis 1 is supported. The poorest WQI Score is seen at Site 2, the best WQI Score is seen at Site 4. • Hypothesis 2 is supported. The WQI Score at Site 4 is 84.47, slightly higher than at Site 1, 83.24. • Literature Cited • Cole, C.A., Shafer, D. 2002. Section 404 wetland mitigation and permit success criteria in • Pennsylvania, USA, 1986-1999. Environmental Management. 30,4,508-515. • Environmental Protection Agency. 1995. Federal guidance for the establishment, use • and operation of mitigation banks. 60:228: 58605-58614. • http://www.epa.gov/owow/wetlands/guidance/mitbankn.html • Hoeltje, S.M. Cole, C.A. 2006. Losing function through wetland mitigation in central • Pennsylvania, USA. Environmental Management. 39:385-402. Hypothesis H1: As water flows through the wetland, from site 2 to site 4, the Water Quality Index (WQI) will improve. H2: The WQI of the perennial stream will not decrease after the addition of water from the wetland. Acknowledgments I would like to thank Mr. Thomas Stich for providing me with the mitigation site, maps, and images, and for his assistance throughout this study. Additionally, I would like to thank Dr. Bruce Smith for his guidance and mentorship throughout this process. Lastly, I would like to thank Ms. Katrina Grau for her help with data collection.