Download
1 / 15
150 likes | 167 Views
One of the leading factors for bad database performance is slow SQL queries. Slow queries directly impact database performance, which also causes many types of application performance issues. As DBAs, it is critical to monitor, find, and rectify slow queries. Addressing SQL query slow performance is one of the top tasks performed as a part of the database Optimization process. In this PPT, we will talk about slow queries and how to handle them for some databases.

E N D
One of the leading factors for bad database performance is slow SQL queries. Slow queries directly impact database performance, which also causes many types of application performance issues. As DBAs, it is critical to monitor, find, and rectify slow queries. Addressing SQL query slow performance is one of the top tasks performed as a part of the database Optimization process. In this PPT, we will talk about slow queries and how to handle them for some databases.
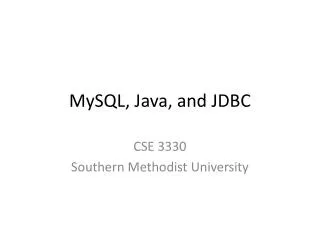
What is a Slow SQL query? A SQL query is considered slow if it takes a much longer time to execute than anticipated. Slow SQL queries tend to degrade database performance and start causing application performance issues.
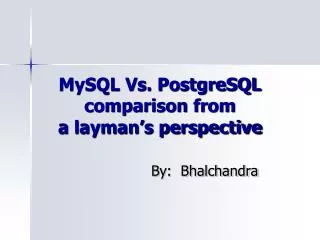
The graph above shows the average time taken by some of the queries running on the Microsoft SQL Server. One of the queries is taking 9 seconds to complete while the others have sub-second execution time. There is a high probability here that the business team would find this unacceptable. Thus, the query needs tuning to run faster.
MySQL queries: Enable Slow Query Log One of the leading ways to find slow queries on MySQL database is to enable slow query log. This is the first step when it comes to MySQL performance tuning during a database optimization process. The slow query log is where the MySQL database server adds entries of queries whose execution time is greater than the set threshold. The threshold values that determine if a query is slow depends on the business requirement. For example, we have worked with some organizations that set the threshold at 1 second while other companies have set a limit of over 5 seconds.
Step #1 Launch MySQL Connect to the terminal of the host machine where MySQL is present and use the following command to launch MySQL. mysql -u <user_name>-p Eg: mysql -u optimizsql -p Once this command is run, it will ask you to enter the password. Upon successful authentication, you will be connected to the MySQL prompt.
Step #2 Configure Slow Query Log To enable the slow query log, you need to first use the enable command and then set the time threshold, which defines a slow query, and also provide the path to the log file. In the MySQL prompt, use the following commands: SET GLOBAL slow_query_log = 'ON'; SET GLOBAL long_query_time = <threshold_time_in_seconds>; SET GLOBAL slow_query_log_file = <path_to_log_file>; In the commands above, you can set your desired time and the path to where the log file should be stored. Example: SET GLOBAL slow_query_log = 'ON'; SET GLOBAL long_query_time = 4; SET GLOBAL slow_query_log_file = '/home/optimizsql/logs/slow_query.log’; With these parameters set, you can start to see the logs of all the queries which take longer than the specified time. Below is a screenshot example of a slow query log.
Postgres Find Slow Queries Finding slow queries on PostgreSQL is different from the ones we have seen earlier. PostgreSQL database maintains a unique table called pg_stat_statementsthat contains various query execution details. Before you can use it, you have to enable the pg_stat_statements table and configure its parameters. Some of the settings to focus during the setup are:
1. Pg_stat_statements.save - This takes either “On” or “Off” as its value. It indicates if the table should be reset when the server instance is restarted. Pg_stat_statements.max - We need to decide on the number of queries that the table should track. If the number is reached, then the oldest query will be pushed out of the table to make space for the new one. Pg_stat_statements.track - Allows the DBA to set the statements that need to be tacked. For example, client statements only, all statements, or none of them.
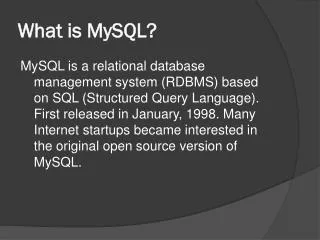
With the pg_stat_statements table enabled, we can use that table to find the slow queries PostgreSQL. The table contains many columns that range from user details, DB instance details, to the queries and its timing information. To get the slow query details, we need to execute a fetch SQL query on this table. The pg_stat_statements table aggregates data for a given query. To find the average time each query is taking, you would have to find the number of calls made and divide it by the total time taken. The following query can be used to fetch the queries which take longer than a specified time limit to execute. select rows, query, calls, (total_time/calls)::integer as avg_millis from pg_stat_statements where calls > 500 order by avg_millisdesc; The query above fetches all the queries where each query has been called over 500 times. The time taken will be shown in milliseconds with the slowest one being on the top. By analyzing the result of this query, you will find the slow queries running on your PostgreSQL database. The image below describes some sample data from a pg_stat_statements table.
Slow SQL query performance is directly related to slow database performance. Now that we have explored methods to identify slow queries, they need to be rectified to improve database performance. There are a few paths to solve this problem. SQL Optimization - SQL Optimization is a database optimization process where an Expert DBA analyzes the slow queries. The goal is to find the reason why it is slow and tackle that. The queries can be slow due to missing indexes, inefficient query code, or even insufficient hardware. Once the root cause is identified, recommendations are provided to fix the issue. Automated Query Tuning - Automated online query optimization tools are among the modern techniques of using data analytics and artificial intelligence to automatically analyze the query and provide recommendations automatically. These tools help DBAs, developers, and designers to improve SQL slow query performance. These days, organizations are using both these approaches to ensure that the query performance is maintained at optimal levels. We recommend using automated methods wherever possible and then proceed towards database optimization manually.