Download
1 / 18
180 likes | 375 Views
Voting Behavior II. Campaigns in Voting Theories. Campaigns in Voting Theories. Campaigns in Voting Theories. Campaigns in Voting Theories. Campaigns in Voting Theories. Funnel of Causality. Long term, stable partisan and policy predispositions

E N D
Funnel of Causality Long term, stable partisan and policy predispositions Current policy preferences and perceptions of current conditions Retrospective evaluations of the president concerning results Impressions of the candidates’ personal qualities Prospective evaluations of the candidates and parties Vote choice
Social class • 1992: • Lowest quintile income: 37% more D than R • 2nd lowest: 33% more D • Middle: 23% more D • 2nd highest: 3% more D • Highest: 9% more R • Union household 30% more D • Non-union household 4% more D
Education • In 1992: • Less than high school: 39% more D than R • High School grad: 22% more D • Some college +: 1% more R
Gender • In 1992: • Male: 1% more D than R • Female: 16% more D than R • In 2004: • Male: 1% more D than R • Female: 11% more D than R • Gender Gap in Party ID: 10%
Religion • In 1992: • Committed mainline Protestant: 17% more R than D • Nominal mainline Protestant 10% more R • Committed evangelical Protestant 3% more R • Nominal evangelical Protestant 20% more D • Committed Catholic 31% more D • Nominal Catholic 28% more D • Jewish 64% more D • Non-religious 18% more D
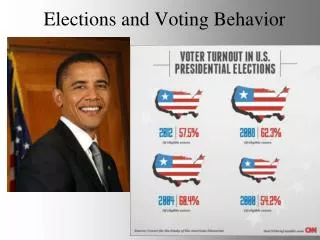
Percent of party identifiers voting for their party’s presidential candidate (Dems)
Funnel of Causality Long term, stable partisan and policy predispositions Current policy preferences and perceptions of current conditions Retrospective evaluations of the president concerning results Impressions of the candidates’ personal qualities Prospective evaluations of the candidates and parties Vote choice