Download
1 / 39
390 likes | 539 Views
Early MODIS Atmospheric Science Products: Radiances, Cloud Detection, Cloud Properties, and Atmospheric Profiles. Steven A. Ackerman, Richard A. Frey, Liam Gumley, Bryan Baum, Mathew Gunshor, Shaima Nasiri, Timothy Schmit, and W. P. Menzel University of Wisconsin, CIMSS NOAA/NESDIS

E N D
Early MODIS Atmospheric Science Products: Radiances, Cloud Detection, Cloud Properties, and Atmospheric Profiles Steven A. Ackerman, Richard A. Frey, Liam Gumley, Bryan Baum, Mathew Gunshor, Shaima Nasiri, Timothy Schmit, and W. P. Menzel University of Wisconsin, CIMSS NOAA/NESDIS July 2000 250 m vis & 1 km WV inter-calibration cloud mask cloud and atm properties cal/val direct broadcast
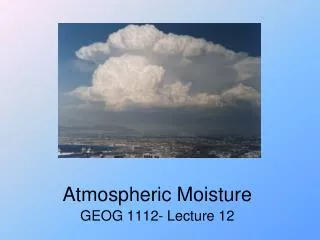
MODIS over St. Petersburg 22 June 2000
MODIS revealing atmospheric moisture details as never before 1 km MODIS WV (left) & 4x8 km GOES WV (right)
Four Panel Zoom of Cloud-Free Orographic Waves revealed in Water Vapor Imagery
MODIS In-flight Performance Issues as of June 2000
MODIS Scan Mirror Reflectance Measurement Scan Mirror RVS in PC Bands
MODIS IR Cal/Val from ER-2 Feb - Mar 2000 Purpose: Validate MODIS L1B MAS S-HIS • Transfer S-HIS cal to MAS • Collocate MODIS FOV on MAS • Remove spatial, spectral and viewing geometry dependencies MAS 11um preliminary Preliminary MODIS FOV
Detecting Clouds (IR) IR Window Brightness Temperature Threshold and Difference Tests IR tests sensitive to surface emissivity and atm PW, dust, and aerosols BT11 < 270 BT11 + aPW * (BT11 - BT12) < SST BT11 + bPW * (BT11 - BT8.6) < SST aPW and bPW determined from lookup table as a function of PW BT3.9 - BT11 > 8 indicates daytime low cloud cover BT11 - BT12 > 2 (rel for scene temp) indicates high cloud BT11 - BT6.7 large negative difference for clear sky over Antarctic Plateau winter CO2 Channel Test for High Clouds BT13.9 < threshold (problems at high scan angle or high terrain)
Detecting Clouds (vis) Reflectance Threshold Test r3.9 > 6% considered to be cloudy and < 3% considered snow/ice problems in bright deserts Near IR Thin Cirrus Test r1.38 > threshold indicates presence of thin cirrus cloud ambiguity of high thin versus low thick cloud (resolved with BT13.9) problems in high terrain Reflectance Ratio Test r.87/r.66 between 0.9 and 1.1 for cloudy regions must be ecosystem specific Snow Test NDSI = [r.55-r1.6]/ [r.55+r1.6] > 0.4 and r.88 > 0.1 then snow
0.65 1.38 µm delineates thin cirrus 1.38 vis senses earth surface reflection
11.0 1.38 µm delineates thin cirrus 1.38 IR sees lower trop clouds as well
1.6 µm image 0.86 µm image 11 µm image 3.9 µm image cloud mask snow test visible test 3.9 - 11 test 11 - 12 test 13.9 high cloud aa • MODIS Cloud Mask (high confidence clear is green, confident is blue, uncertain is red, cloudy is white) • Snow test determines which spectral tests / thresholds are used • Visible test is not used over snow-covered areas (shown as black) • 3.9-11 m test finds primarily low clouds • 11-12 m test primarily finds high clouds • 13.9 m test is causing uncertainty in colder regions (should improve with stable calibration)
Visible Composite Clear-sky Values for 4-7 May 2000 Derived from the MODIS Cloud Mask
IR Window Tb Composite Clear-sky Values for 4-7 May 2000 Derived from the MODIS Cloud Mask
Investigations / Improvements pending for • MODIS Cloud Mask • Sun-glint regions • Warm cloud scenes in arid ecosystems, day / night • Antarctica • Low-level clouds on land at night • Snow/ice surfaces at night
CLS, HIRS, and Raob Cal/Val of MODIS cloud properties • On March 12, a high-altitude research aircraft (ER-2)flewunder Terra as it traversed central North America from north to south • Part of the ER-2 flight track (yellow line) is shown, superimposed on the MODIS 0.86 m image from 17:10Z • This scene is the same one as shown in the cloud top properties examples • The cloud mask result is important input to the MODIS cloud top properties algorithm. Note that the mask properly discriminates snow from cloud in almost all cases • Aircraft nadir-viewing LIDAR cloud top pressures from the CLS (Cloud Lidar System) on board the ER-2 are compared to MODIS retrievals • LIDAR cloud top pressure values are shown in the histogram • The red line in the above image shows the approximate coverage area of the CLS data • Histograms of MODIS cloud top pressure retrievals are compared with NOAA-14 HIRS (CHAPS) values from the same region • The CHAPS (Collocated HIRS and AVHRR products) data were collected about 3 hours later in the day
CLS, HIRS, and Raob Cal/Val of MODIS cloud properties • There is generally good agreement between LIDAR and MODIS results but note that the LIDAR covers a much smaller area than MODIS • The LIDAR is capable of sensing very thin cirrus clouds shown by the solid bar at 300-399 mb which is largely missing from the MODIS results • Good agreement is also seen between MODIS and CHAPS, where the smaller FOV of the MODIS leads to more clear-sky values • A comparison between CHAPS and MODIS cloud effective emissivities reveals good agreement between the two, with MODIS finding more clear-sky scenes due to higher spatial resolution • A sounding taken at the CART Site beginning at 17:29Z reveals a rapid increase in dew point depression at approximately 450 mb • This agrees with the peak frequency of cloud top pressures in both the MODIS and CHAPS histogram
ER-2 flight track on MODIS 0.86 um image from 1710 UTC Associated cloud mask ER-2 flew under the Terra on March 12, 2000 (WISC-T2000 Field Experiment)
VIS CM MODIS Cloud Mask CTP N MODIS Cloud Properties r>95 b>75 g>50 y>25 r 3-4 g 4-5 b 5-6
Comparison of CLS (nadir view), HIRS (3 hrs later), RAOB, & MODIS Cloud Properties
MODIS cloud thermodynamic phase vis IRW cloud phase Ice Mixed Phase Clouds over Southern India on 19 April 2000 Water Uncertain
Atmospheric TPW clear sky water vapor (mm) MODIS 420 UTC GOES 400 UTC Upper Midwest 11 May 2000 • MODIS TPW is regression based and uses no surface observations • GOES Sounder TPW is simultaneous physical retrieval of T and q using surface obs and NWP model first guess • Similar values and gradients are evident (correlation coefficient = 0.7) • Both capture most moist regions in eastern and western Iowa • “30” is TPW from RAOB at 00 UTC Chanhassen, MN
Atmospheric Properties (TPW) MODIS showing moist bias
Atmospheric Profiles of Temperature and Moisture MODIS regression-based retrieval uses no surface obs; GOES simultaneous physical retrieval uses surface obs and NWP model as first guess. Qualitatively, two are in good agreement with exception of near-surface levels.
MODIS atmospheric investigations at UW 1 km WV IR cal comparison with MAS and GOES 1.38 um thin cirrus detection multi-spectral cloud mask cloud heights with CO2 slicing cloud phase with tri-spectral window TPW with sounding channels 36 channel AVHRR or 1 km HIRS UW MODIS QA web site and links to data examples http://cimss.ssec.wisc.edu/modis1/modis1.html Progress on Direct Broadcast International MODIS Processing Package liam.gumley@ssec.wisc.edu
EOS Direct Broadcast via X-band • Acquire and use EOS direct broadcast data to regional users so that they can • access MODIS data in real time and generate products, • assist MODIS validation by supporting field campaigns, • provide outreach to the non-EOS community • An International MODIS Processing Package is being developed that will • provide software to transform Level-0 to Level-1B and a selection of geophysical products, • enable the international community to participate directly in MODIS science
RVS correction produces symmetric scene wrt scan angle 11.0 13.9
Old New
Old 1.6 µm image 0.86 µm image 11 µm image 3.9 µm image cloud mask snow test vis test 13.9 high cloud 3.9 - 11 test 11 - 12 test aa • MODIS Cloud Mask (high confidence clear is green, confident is blue, uncertain is red, cloudy is white) • Snow test determines which spectral tests / thresholds are used • Visible test is not used over snow-covered areas (shown as black) • 3.9-11 m test finds primarily low clouds • 11-12 m test primarily finds high clouds • 13.9 m test is causing uncertainty in colder regions (should improve with stable calibration)
Old ER-2 flight track on MODIS 0.86 um image from 1710 UTC Associated cloud mask ER-2 flew under the Terra on March 12, 2000 (WISC-T2000 Field Experiment)
VIS CM MODIS Cloud Mask Old CTP N MODIS Cloud Properties r>95 b>75 g>50 y>25 r 3-4 g 4-5 b 5-6
Comparison of CLS (nadir view), HIRS (3 hrs later), RAOB, & MODIS Cloud Properties Old