Download
1 / 1
10 likes | 139 Views
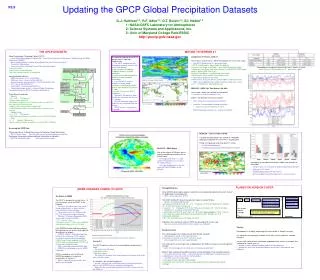
Hydrologic simulations of the Upstream of Major Rivers in the Tibetan Plateau. Fengge Su 1 , Leilei Zhang 1,2 , Kai Tong 1,2 , Zhenchun Hao 2 , and Cuo Lan 1. 1 Institute of Tibetan Plateau Research, Chinese Academy of Sciences, Beijing 100085, China. E-mail: fgsu@itpcas.ac.cn

E N D
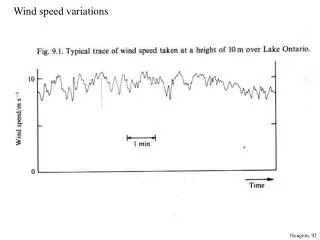
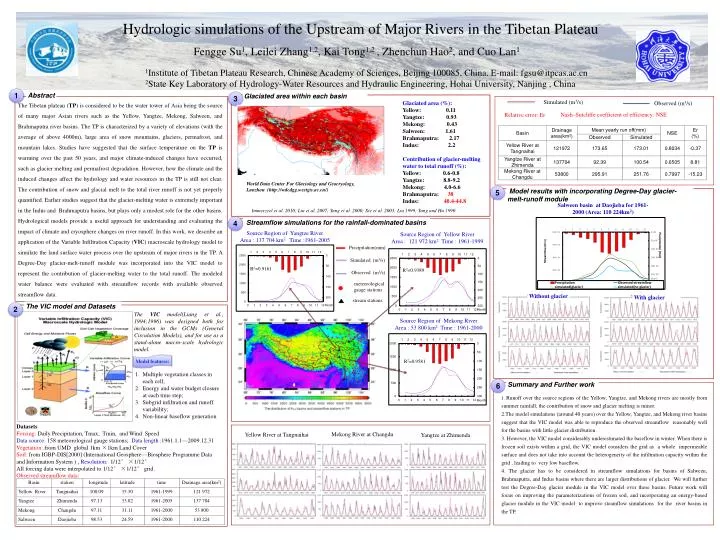
Hydrologic simulations of the Upstream of Major Rivers in the Tibetan Plateau Fengge Su1, Leilei Zhang1,2, Kai Tong1,2 , Zhenchun Hao2, and Cuo Lan1 1Institute of Tibetan Plateau Research, Chinese Academy of Sciences, Beijing 100085, China. E-mail: fgsu@itpcas.ac.cn 2State Key Laboratory of Hydrology-Water Resources and Hydraulic Engineering, Hohai University, Nanjing , China 1 Abstract Glaciated area within each basin 3 Simulated (m3/s) Glaciated area (%): Yellow: 0.11 Yangtze: 0.93 Mekong: 0.43 Salween: 1.61 Brahmaputra: 2.17 Indus: 2.2 Contribution of glacier-melting water to total runoff (%): Yellow: 0.6-0.8 Yangtze: 8.8-9.2 Mekong: 4.0-6.6 Brahmaputra: 38 Indus: 40.4-44.8 The Tibetan plateau (TP) is considered to be the water tower of Asia being the source of many major Asian rivers such as the Yellow, Yangtze, Mekong, Salween, and Brahmaputra river basins. The TP is characterized by a variety of elevations (with the average of above 4000m), large area of snow mountains, glaciers, permafrost, and mountain lakes. Studies have suggested that the surface temperature on the TP is warming over the past 50 years, and major climate-induced changes have occurred, such as glacier melting and permafrost degradation. However, how the climate and the induced changes affect the hydrology and water resources in the TP is still not clear. The contribution of snow and glacial melt to the total river runoff is not yet properly quantified. Earlier studies suggest that the glacier-melting water is extremely important in the Indus and Brahmaputra basins, but plays only a modest role for the other basins. Hydrological models provide a useful approach for understanding and evaluating the impact of climate and cryosphere changes on river runoff. In this work, we describe an application of the Variable Infiltration Capacity (VIC) macroscale hydrology model to simulate the land surface water process over the upstream of major rivers in the TP. A Degree-Day glacier-melt-runoff module was incorporated into the VIC model to represent the contribution of glacier-melting water to the total runoff. The modeled water balance were evaluated with streamflow records with available observed streamflow data. Observed (m3/s) Nash–Sutcliffe coefficient of efficiency: NSE Relative error: Er World Data Center For Glaciology and Geocryology, Lanzhou (http://wdcdgg.westgis.ac.cn/) 5 Model results with incorporating Degree-Day glacier-melt-runoff module Salween basin at Daojieba for 1961-2000 (Area: 110 224km2) Immerzeel et al. 2010; Liu et al. 2007; Yang et al. 2000; Xie et al. 2003; Liu 1999; Yang and Hu 1990 4 Streamflow simulations for the rainfall-dominated basins Source Region of Yangtze River Area : 137 704 km2 Time :1961-2005 Source Region of Yellow River Area : 121 972 km2 Time : 1961-1999 Precipitation(mm) Simulated (m3/s) R2=0.9161 R2=0.9389 Observed (m3/s) meteorological gauge stations Without glacier With glacier stream stations The VIC model and Datasets 2 The VIC model(Liang et al., 1994;1996) was designed both for inclusion in the GCMs (General Circulation Models), and for use as a stand-alone macro-scale hydrologic model. Source Region of Mekong River Area : 53 800 km2 Time : 1961-2000 Model features: R2=0.9581 • Multiple vegetation classes in each cell; • Energy and water budget closure at each time step; • Subgrid infiltration and runoff variability; • Non-linear baseflow generation 6 Summary and Further work • Runoff over the source regions of the Yellow, Yangtze, and Mekong rivers are mostly from summer rainfall; the contribution of snow and glacier melting is minor. • The model simulations (around 40 years) over the Yellow, Yangtze, and Mekong river basins suggest that the VIC model was able to reproduce the observed streamflow reasonably well for the basins with little glacier distribution. • 3. However, the VIC model considerably underestimated the baseflow in winter. When there is frozen soil exists within a grid, the VIC model considers the grid as a whole impermeable surface and does not take into account the heterogeneity of the infiltration capacity within the grid , leading to very low baseflow. • 4. The glacier has to be considered in streamflow simulations for basins of Salween, Brahmaputra, and Indus basins where there are larger distributions of glacier. We will further test the Degree-Day glacier module in the VIC model over these basins. Future work will focus on improving the parameterizations of frozen soil, and incorporating an energy-based glacier module in the VIC model to improve steamflow simulations for the river basins in the TP. Datasets Forcing: Daily Precipitation, Tmax, Tmin, and Wind Speed Data source: 158 meteorological gauge stations; Data length :1961.1.1—2009.12.31 Vegetation: from UMD global 1km ×1km Land Cover Soil: from IGBP-DIS[2000] (International Geosphere—Biosphere Programme Data and Information System ) , Resolution: 1/12° ×1/12° All forcing data were interpolated to 1/12° ×1/12° grid. Observed streamflow data: Mekong River at Changdu Yellow River at Tangnaihai Yangtze at Zhimenda