Download
1 / 15
150 likes | 255 Views
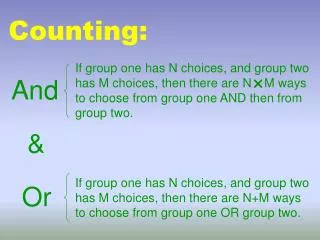
Counting Statistics. 31. 32. Statistical Accuracy. Factors that affect statistical accuracy :. Count rate Count time Background Equipment efficiency . Sample vol. Geometry Moisture absorption. Events. 33. Error Reduction. Peer Check STAR Procedure Use and Adherence.

E N D
Counting Statistics HPT001.011 Revision 3 Page of 45 31
HPT001.011 Revision 3 Page of 45 32 Statistical Accuracy • Factors that affect statistical accuracy: • Count rate • Count time • Background • Equipment efficiency • Sample vol. • Geometry • Moisture absorption
Events HPT001.011 Revision 3 Page of 45 33 Error Reduction • Peer Check • STAR • Procedure Use and Adherence
Accuracy and Precision 34 HPT001.011 Revision 3 Page of 45
HPT001.011 Revision 3 Page of 45 35 Standard Deviation Where’s the mean? • Represented by the Greek symbol sigma • One is the distance from the peak out to a vertical line enclosing 34.15% of the total area under the curve
HPT001.011 Revision 3 Page of 45 36 Frequency Distribution • Data is plotted on a histogram • Height of bar represents frequency of occurrence
HPT001.011 Revision 3 Page of 45 37 Poisson Distribution • Probability of “success” is low • Number of trials is high
Gaussian Distribution 38 • Symmetrical about the mean • One includes 68.3% of area under curve HPT001.011 Revision 3 Page of 45
Confidence Level 39 1 = 68.3 % confidence level 2 = 95.4 % confidence level HPT001.011 Revision 3 Page of 45
HPT001.011 Revision 3 Page of 45 40 Minimum Detectable Count Rate • Calculated using the equation: MDC = 2.71 + 3.3 [B(tb+ts)/tb]1/2 where: MDC is the minimum dectectable counts; B is the background counts; tb is the background counting time, minutes; ts is the sample counting time, minutes. MDCR = MDC/ts
HPT001.011 Revision 3 Page of 45 41 MDCR Application • If gross count rate is > (Bkd + MDCR): It may be concluded with 95% confidence that radioactivity is present above natural background. Calculate results using normal processes.
HPT001.011 Revision 3 Page of 45 42 MDCR Application (cont’d) • If gross count rate is < (Bkd + MDCR): record as "< MDA".
HPT001.011 Revision 3 Page of 45 43 Lower Limit of Detection • Calculated using the equation: LLD (Ci/cc) = 4.66 b (2.22E6)(E)(V)(Y)(D) where: V is the sample volume in cc; E is the counter efficiency (cts/dis); Y is the chemical yield if applicable; D is the decay correction for delayed count on sample. 2.22E6 is a conversion factor - dpm per Ci
HPT001.011 Revision 3 Page of 45 44 Chi-Square Test • Calculated using the equation: x2 = (n-)2 where: n = the data for each count; = the average of the individual counts; = n/N N = the number of observations (usually 21)
HPT001.011 Revision 3 Page of 45 45 Chi-Square Test