Download
1 / 39
400 likes | 577 Views
Latitude and Longitude. Unit 2: Mapping. Latitude and Longitude Field Maps Topographic Maps NYS Landscapes Quadrangle Maps. Latitude and Longitude. How to find a location on earth’s surface. Latitude and Longitude. Map – a projection that shows all parts of earth’s surface.

E N D
Unit 2: Mapping Latitude and Longitude Field Maps Topographic Maps NYS Landscapes Quadrangle Maps
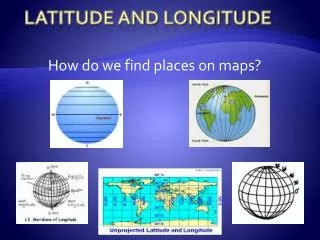
Latitude and Longitude How to find a location on earth’s surface
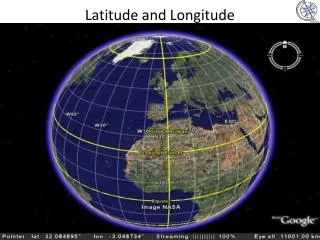
Latitude and Longitude Map – a projection that shows all parts of earth’s surface
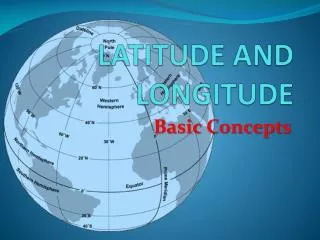
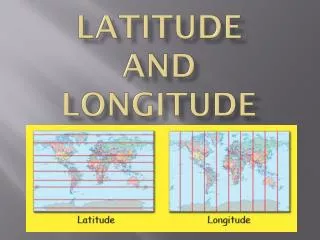
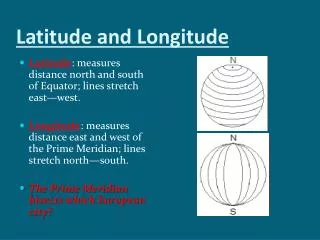
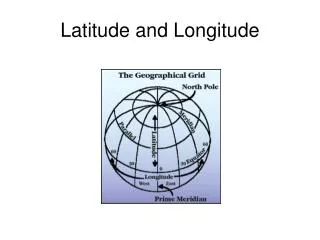
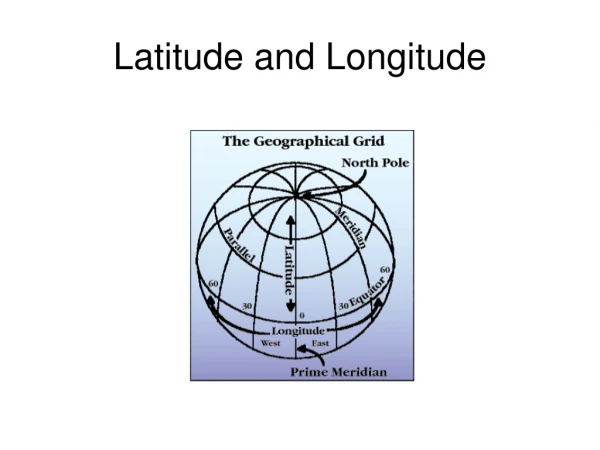
Latitude and Longitude • Latitude – measuring lines running parallel to the equator • Also called parallels • These lines NEVER intersect!! • Equator – main reference line of Latitude (0˚ latitude)
Latitude and Longitude North Pole is at 90˚ N Latitude South Pole is at 90˚ S Latitude
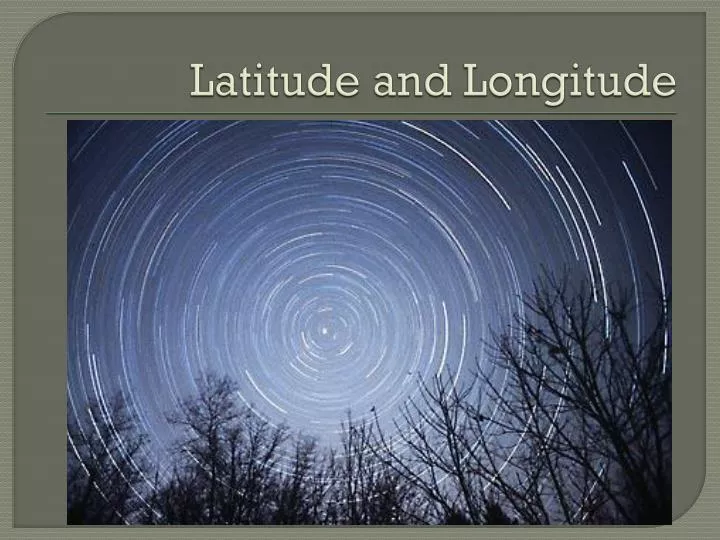
Latitude and Longitude Polaris Horizon α α = angle from the horizon to Polaris • Finding your latitude: • The altitude (angle) of Polaris (the north star) is equal to your latitude. • Polaris can only be seen in the Northern Hemisphere.
Latitude and Longitude • Longitude – measuring lines that run east and west from the Prime Meridian • Longitude lines are also called meridians • Prime Meridian – main reference line of longitude (0˚ Longitude)
Latitude and Longitude Prime Meridian is 0˚ longitude The International Date Line is on the opposite side of the Prime Meridian and is 180˚ east OR west
Latitude and Longitude Combine latitude and longitude to create a grid system
Latitude and Longitude • Make sure you include direction with both latitude and longitude • Example: 20˚30’ N, 75˚30’ E • Subdivisions of latitude and Longitude: • One degree is divided into 60 minutes (60’) • One minute can be broken down into 60 seconds (60”)
Latitude and Longitude • Time Zones: • Rotation of the earth provides a basis for our system of local time • The earth rotates 360˚ in 24 hours • Earth rotates on an imaginary axis at 15˚ per hour • Earth is divided into 24 (15˚) time zones
Latitude and Longitude ˚ • Time zones (continued) • Each time zone is one hour different • Each time zone covers 15˚ of “meridians of longitude” on the Earth’s surface • There are 6 time zones in the United States
Field Maps What are the different types of field maps?
Field Maps ˚ • Field – a region with a measurable quantity at every location • Examples: temperature values, elevation, depth, atmospheric pressure, pollution levels, and wind speeds
Field Maps ˚ • Isolines- are lines that are drawn on a field map to collect all of the points on that map that have the same value • Examples: isotherms and contour lines
Field Maps ˚ • Points represent values of data found at a specific location • This map shows amounts of pollutants found in the ground water at different locations
Field Maps ˚ • To construct a field map connect the points of equal data • This example is a water pollution field map with the 40 parts per million isoline drawn
Field Maps ˚ • Isolines- usually do no connect every value, rather whole numbers • This is an example of isolines drawn in at an interval of 10 ppm
Field Maps ˚ • Isotherm- are lines drawn in on a map that connect points of equal temperature
Field Maps ˚ • Gradient (slope) – rate of change from place to place within a field
Field Maps ˚ gradient = 0.6 ppm/m
Topographic Maps How do topographic maps help us interpret our planet?
Topographic Maps • BM. X. indicates a benchmark • The X is the exact location of a spot where a metal marker is in the ground indicating the latitude, longitude, and elevation
Topographic Maps • Depression contours - are marked with small lines called hachure lines that are pointed toward the center of a depression • This allows you to distinguish a hill from a hole
Topographic Maps • Calculating the highest point: • Find the last (highest) contour line on that hill • Imagine you drew another line • Subtract one from the imaginary line
Topographic Maps The highest possible elevation of the hill is 239 meters
Topographic Maps • Contour line rules: • Contour lines close around hills, basins, and depressions • Contour lines never ever cross • Contour lines form V’s that point upstream whenever crossing a stream
Topographic Maps Topographic profile: the side view of a mountain, hill, or depression
Topographic Maps • Creating a profile: • Step 1: You need two points on a topographic map
Topographic Maps • Creating a profile: • Step 2: You need a horizontal grid between two points
Topographic Maps • Creating a profile: • Step 3: Transfer points from the contour map to the horizontal grid
Topographic Maps • Creating a profile: • Step 4: connect the points with a smooth line to draw the profile
Topographic Maps Final product: a cross section of the landscape
Topographic Maps ˚ With more complex profiles you may need to transfer the elevation information to the side of a piece of paper and then transfer it to your horizontal grid
NYS Landscape Regions What are the different landscapes of New York?