Download

1 / 34
340 likes | 435 Views
The Urban Growth Management Initiative: Preliminary Results. Daniel L. Civco and Anna Chabaeva Center for Land use Education And Research (CLEAR) Natural Resources Management and Engineering University of Connecticut Shlomo Angel Robert F. Wagner School of Public Service, New York University

E N D
The Urban Growth Management Initiative:Preliminary Results Daniel L. CivcoandAnnaChabaeva Center for Land use Education And Research (CLEAR) Natural Resources Management and Engineering University of Connecticut Shlomo Angel Robert F. Wagner School of Public Service, New York University Woodrow Wilson School of Public & International Affairs, Princeton University Stephen Sheppard Department of Economics Williams College A project sponsored by the World Bank Urban Development Division
Background • The United Nation predicts that the population ofdeveloping countries is growing at an annual rate of 2.3% • Within 30 years, that population will double from 1.94 billion in 2000 to 3.88 billion in 2030 • The built environment, however, will more than double during this period • Yet, there is little systematic data to estimate, let alone to explain, current and future levels of urban expansion The Urban Growth Management Initiative March 9, 2005, ASPRS, Baltimore, MD
United Nations Urban Land Management Initiative Objectives • Study the causes and consequences of urban expansion • Prepare viable models of minimalist urban growth management The Urban Growth Management Initiative March 9, 2005, ASPRS, Baltimore, MD
Urban Mapping Objectives • Use moderate resolution satellite remote sensing data to map the extent of urban land for a sample of 120 cities around the world • Two time periods • Circa 1990 and 2000 • Provide complementary data for use in modeling and understanding the causes and consequences of urban expansion • physical,economic and demographic data The Urban Growth Management Initiative March 9, 2005, ASPRS, Baltimore, MD
Study Cities • A stratified sample of 120 cities was selected from a universe of 2,719 cities with metro-area population in excess of 100,000 in the year 2000 • Three important characteristics were used to define the strata: • the world region in which the city is located • city population size • its level of economic development, measured by national per capita income • The universe of cities was divided into nine regions, four size categories, and four per–capita income groups The Urban Growth Management Initiative March 9, 2005, ASPRS, Baltimore, MD
Study Cities The Urban Growth Management Initiative March 9, 2005, ASPRS, Baltimore, MD
Data • Landsat TM and ETM • Circa 1990 and 2000 • Proximal to date of nearest census • Near anniversary • As cloud-free as possible • USGS Global Visualization Viewer • Earth Observing System Data Gateway • EarthSat’s GeoCover Ortho Landsat TM Product • GeoCover-Ortho Stock Scenes • GeoCover-Ortho Custom Projection The Urban Growth Management Initiative March 9, 2005, ASPRS, Baltimore, MD
Data Administrative Units from the Center for International Earth Science Information Network (CIESIN) of the Columbia University’s Earth Institute Moscow October 2002 Moscow October 1991 The Urban Growth Management Initiative March 9, 2005, ASPRS, Baltimore, MD
Data Moscow October 2002 Moscow October 1991 The Urban Growth Management Initiative March 9, 2005, ASPRS, Baltimore, MD
Data GeoCover Landcover Data Urban Growth Management Initiative Data Source: Landsat ETM, 5 January 2000 Addis Ababa, Etiopia The Urban Growth Management Initiative March 9, 2005, ASPRS, Baltimore, MD
Data GeoCover Landcover Data Urban Growth Management Initiative Data Source: Landsat ETM, 21 May 2000 Tel Aviv, Israel The Urban Growth Management Initiative March 9, 2005, ASPRS, Baltimore, MD
N Y Methods T1 Image Cluster 50 Clusters Label & Recode Extract Confused Done? Onscreen Edit 7 Classes Recode T2 Urban T1 Urban Mask T2 Image The Urban Growth Management Initiative March 9, 2005, ASPRS, Baltimore, MD
T1 Urban Landsat T2 Mask T2 Urban Final T2 Classification Final T1 Classification Landsat T2 Landsat T2 1st Pass T2 Classification Landsat T1 First Pass T1 Classification 2nd PassT1 Classification Landsat T1 Mask Methods Moscow The Urban Growth Management Initiative March 9, 2005, ASPRS, Baltimore, MD
Methods Moscow October 2002 Moscow October 1991 The Urban Growth Management Initiative March 9, 2005, ASPRS, Baltimore, MD
Results To Date • Average time span between T1 and T2 • 11.0 Years • Minimum Annual Urban Growth • 0.7 % (Astrakhan, Russia) • Maximum Annual Urban Growth • 20.1 % (Yiyang, China) • Mean Annual Urban Growth • 4.8 % • Median Annual Urban Growth • 3.3 % Based on 86 Cities The Urban Growth Management Initiative March 9, 2005, ASPRS, Baltimore, MD
Results To Date The Urban Growth Management Initiative March 9, 2005, ASPRS, Baltimore, MD
11 Of 86 13% 17 of 86 20 % 22 of 86 26 % 36 of 86 / 42 % Urban Growth The Urban Growth Management Initiative March 9, 2005, ASPRS, Baltimore, MD
Urban Growth 36 of 86 The Urban Growth Management Initiative March 9, 2005, ASPRS, Baltimore, MD
Urban Growth 22 of 86 The Urban Growth Management Initiative March 9, 2005, ASPRS, Baltimore, MD
Urban Growth 17 of 86 The Urban Growth Management Initiative March 9, 2005, ASPRS, Baltimore, MD
Urban Growth 11 of 86 The Urban Growth Management Initiative March 9, 2005, ASPRS, Baltimore, MD
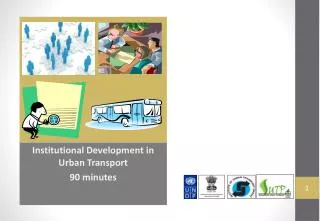
Yiyang July 1994 Yiyang September 1999 Yiyang Urban Growth: July 1994–September 1999 104 % Total / 20.1 % Per Annum Yiyang July 1994 Yiyang September 1999 16 km Urban Growth Examples Yiyang, China The Urban Growth Management Initiative March 9, 2005, ASPRS, Baltimore, MD
Leipzig Urban Growth: July 1989–September 1999 104 % Total / 10.2 % Per Annum Leipzig July 1989 Leipzig September 1999 Leipzig July 1989 Leipzig September 1999 16 km Urban Growth Examples Leipzig, Germany The Urban Growth Management Initiative March 9, 2005, ASPRS, Baltimore, MD
Houston December 1990 Houston Urban Growth: December-October 1999 29 % Total / 3.3 % Per Annum Houston October 1999 Houston December 1990 Houston October 1999 64 km Urban Growth Examples Houston, Texas The Urban Growth Management Initiative March 9, 2005, ASPRS, Baltimore, MD
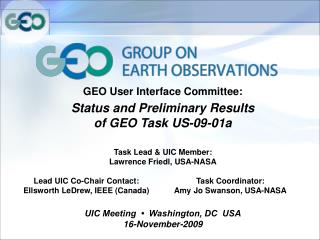
Yulin Urban Growth: October 1991-October 2000 142 % Total / 15.8 % Per Annum Yulin October 1991 Yulin October 2000 Yulin October 1991 Yulin October 2000 16 km Urban Growth Examples Yulin, China The Urban Growth Management Initiative March 9, 2005, ASPRS, Baltimore, MD
Preliminary Accuracy Assessment 12 City Sample of T1 Classifications Overall Kappa 0.8417 The Urban Growth Management Initiative March 9, 2005, ASPRS, Baltimore, MD
Preliminary Accuracy Assessment 12 City Sample of T2 Classifications Overall Kappa 0.8160 The Urban Growth Management Initiative March 9, 2005, ASPRS, Baltimore, MD
Number of People Housing and Services Urban Area Observations • The Urban Growth Management Initiative: Confronting the Expected Doubling of the Size of Cities in Developing Countries in the Next Thirty Years • Recent UN Predictions • 6.5 to 9.1 Billion Humans in Next 50 Years Between 100% and 144% over the next 30 years The Urban Growth Management Initiative March 9, 2005, ASPRS, Baltimore, MD
Current Status • 100 + Metropolitan Areas Fully Classified • T1 and T2 • Change Analysis Performed for 86 • Accuracy Assessment Conducted on 10% The Urban Growth Management Initiative March 9, 2005, ASPRS, Baltimore, MD
Future • Completion of all 120 cities (by end of March) • Establish present global norms of urban land growth for different types of cities • Examine land consumption and urban poverty • overcrowding, access to piped water and sewerage, and access to home ownership • Investigate physical constraints to urban growth • Elevation, slope, terrain ruggedness, water barriers • Develop enhancements to urban land cover classification and characterization • Make data available on the Web The Urban Growth Management Initiative March 9, 2005, ASPRS, Baltimore, MD
Acknowledgments • Dr. Robert Buckley • The Transport and Urban Development Department, Urban Development Division, World Bank • Williams College Students • Tomoko Harigaya, Wei Wang, Vladimir Andonov, Syed Kashif Akhtar, Victoria Wolff, Peng (Bruce) Ou, Timothy Crawley • CLEAR Staff and Graduate Students • Jason Parent, Scott Bighinatti, James Hurd The Urban Growth Management Initiative March 9, 2005, ASPRS, Baltimore, MD
Acknowledgments University of Connecticut Students from Fall 2004 NRME 237 Introductory Remote Sensing The Urban Growth Management Initiative March 9, 2005, ASPRS, Baltimore, MD
The Urban Growth Management Initiative:Preliminary Results Daniel L. CivcoandAnnaChabaeva Center for Land use Education And Research (CLEAR) Natural Resources Management and Engineering University of Connecticut Shlomo Angel Robert F. Wagner School of Public Service, New York University Woodrow Wilson School of Public & International Affairs, Princeton University Stephen Sheppard Department of Economics Williams College Thank you ! A project sponsored by the World Bank Urban Development Division