Download
1 / 168
1.71k likes | 1.88k Views
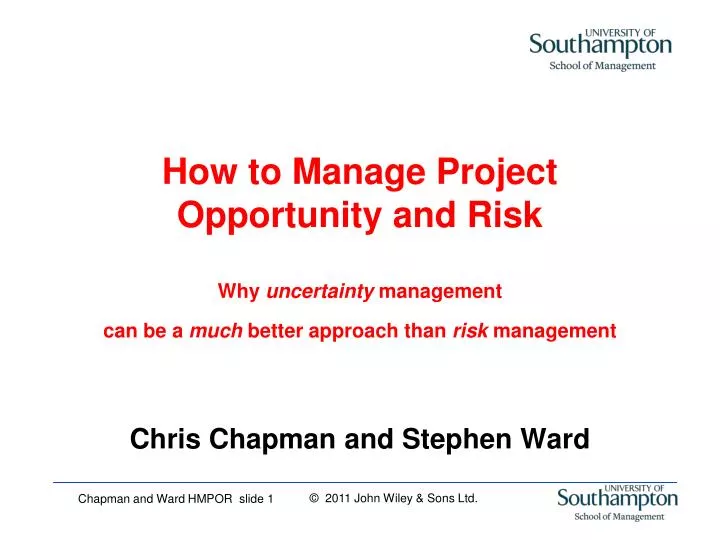
How to Manage Project Opportunity and Risk Why uncertainty management can be a much better approach than risk management. Chris Chapman and Stephen Ward . Some introductory comments. What do you want to take away? Course structure Course text Other reading Case studies

E N D
How to Manage Project Opportunity and RiskWhy uncertainty management can be a much better approach than risk management Chris Chapman and Stephen Ward
Some introductory comments • What do you want to take away? • Course structure • Course text • Other reading • Case studies • Participant background variations • Other issues • Questions?
Part one – setting the scene An unrestricted view of basic definitions A broad view of projects Two key project frameworks Uncertainty, risk and opportunity relationships Some key perspectives and concepts Key motives for uncertainty management Generic process frameworks
Basic definitions and their nominal/default nature • Uncertainty – lack of certainty • Risk – possible unfavourable outcomes • Opportunity – possible favourable outcomes
Projects (programmes and portfolios) Turner (1992) provides a useful illustrative definition of a project: an endeavour in which human, material and financial resources are organised in a novel way, to undertake a unique scope of work of given specification, within constraints of cost and time, so as to achieve unitary, beneficial change, through the delivery of quantified and qualitative objectives.
component Project system examples Time (a) Chain configuration: stages in a primary project may be managed as a chain of component projects. primary project component component Time primary project (b) Parallel configuration: aspects of a primary project may be managed as a set of parallel component projects. component project component project component project Time primary project secondary project tertiary project (c) Project hierarchy: the primary project as a three-level hierarchy of component projects. component component component secondary project tertiary project tertiary project
Corporate, operations and project management as three interlocking perspectives
Key project definition questions – the seven Ws whichway who plans for relationships and contracts all project parties ultimately involved why when plans for business case purposes project motives: profit and other motives integration of all plan-based timetables what resource plans for operations plans for operations the design of the product of the project resource plans for activities plans for activities where - the location of the project and all the relevant wider context issues wherewithal
Key components of uncertainty • Ambiguity uncertainty • Inherent variability • Event uncertainty • Systemic uncertainty
Most ‘sources of uncertainty’ are composites of two or more of these basic components of uncertainty, decomposition of uncertainty raises key questions about what structure is best suitedto the decomposition task in the particular context involved, and ‘events’ or ‘conditions’ is never the exclusive or universal answer.
Using the performance lens and the knowledge lens how does this project fit our overall strategy and operations plans? do we want to continue to develop this project? ‘the project’ performance lens knowledge lens uncertainty about the achievement of objectives what else do we need to know to get to the next stage? opportunity and risk all other views of uncertainty uncertainty what do we need to do to get to the next stage? how should we shape our plans to get to the next stage?
The role of criteria-plan relationship structures • Plans for activities • Resource plans for activities • Plans for operations • Resource plans for operations • Plans for relationships and contracts • Plans for business case purposes • Integration of all plan-based timetables • The design of the product of the process • All the motives for being involved in the project • All the parties involved with relevant plans
Density format portrayal Probability 0 0 5 6 10 14 15 Outcome value 1.0 Cumulative probability format Cumulative probability 0.5 the median is equal to the expected value 0 0 5 10 15 Outcome value Possible criteria value outcomes: a simple interval estimate example
Probability presumed reality, although multiple modes may be involved working assumptions for the model 0 0 5 6 10 14 15 Outcome value An illustration of the approximation involved using a density portrayal
Targets, commitments and expected values • Using P10 a default target, and alternatives • Using P90 as a default commitment, and alternatives • Expected values, and alternative ‘best estimates’ • Provisions • Contingencies • Range estimates as a default, and point estimate alternatives • Expected values as an opportunity/risk datum, and alternatives • A clear opportunity/risk/uncertainty relationship • Clarifying relationships between plans and outcomes
p3 = 1 high r3 r4 r5 Probability p2 r2 r3 r4 medium p1 low r1 r2 r3 p0 = 0 i0 = 0 i1 i2 i3 low medium high Impact A basic probability-impact grid (PIG)
base estimate value 1.0 1 2 3 P90 Cumulative probability P50 0.5 Probability curves show the cumulative effect of: 1. base value estimating uncertainty 2. uncertainty associated with previous risk registers 3. other uncertainty sources which the HA is held accountable for which have not been considered at a portfolio level P10 0 100 150 200 Cost as a % of the base estimate value Sensitivity diagram: Highways Agency example
1.0 P90 Cumulative probability P50 0.5 A B C P10 0 Cost Decision diagram: three approaches example
Clarity efficiency: ‘efficient frontier’ portrayal competent management area clarity (insight which can be shared) non-feasible area a incompetent management area b1 Key: b2 a-c efficient boundary target, with a maximum clarity approach c minimum clarity approach bi intermediate approaches c-d inappropriate clarity levels ei inefficient approaches e2 e3 e1 b3 c d cost (of acquiring clarity)
1 0 Probability curves show the cumulative effect of the following sources of uncertainty: 4. material delivery delays 1. yard not available, or mobilisation delays 2. construction problems / adverse weather 3. subcontracted nodes delivery delays 5. industrial disputes 6. delayed award of fabrication contract Sensitivity diagram: activity level example Base plan completion date Probability of achievement by dates indicated 0.9 1 2 3 0.8 4 0.7 5 0.6 6 0.5 0.4 0.3 0.2 0.1 Dec Jan Feb Mar May Jun Jul Aug Oct Nov Apr Sep 5th year Notes: 1. the curves assume a minimum fabrication period of 20 months 2. no work is transferred offsite to improve progress 3. no major fire, explosion or other damage
Risk efficient options: ‘efficient frontier’ portrayal competent management area (opportunity management area) expected reward (profit or a more general composite of positive objectives) non-feasible area a incompetent management area b1 Key: a-c efficient boundary target, with a maximum reward approach c minimum reward approach biintermediate reward approaches c-d inappropriate reward levels ei inefficient approaches b2 e1 e2 e3 b3 c d risk (in terms of all relevant objectives)
1.0 3.0 m barge curve Cumulative probability 1.6 m barge curve 0.5 0 Cost expected cost using the 3.0 m barge expected cost using the 1.6 m barge Decision diagram: one risk efficient choice example
1.0 Cumulative probability 1.6 m barge curve 0.5 3.0 m barge curve 0 Cost expected cost using the 1.6 m barge expected cost using the 3.0 m barge Decision diagram: two risk efficient choices example
Basic PUMP process flowchart start define the project focus the process identify sources, responses, conditions the context is important in each of the seven phases structure all uncertainty clarify ownership quantifysomeuncertainty evaluate allimplications stop
Example PUMP bar chart for the first pass PUMP phase start of the process end of the first complete cycle define focus identify structure ownership quantify evaluate intense activity Key: ongoing activity intermittent activity
Five key shortcomings of common practice risk management processes
Five more key shortcomings of common practice risk management processes
Part two – the basic PUMP process • Assume the project is in the execution and delivery strategy shaping stage most of the time • Assume a client perspective most of the time • Assume a high clarity approach most of the time
The process as a programme of projects • Each phase is a project – use the Gantt chart • The programme is a portfolio of 7 projects • The portfolio needs holistic management • Everything we know about good project and programme/portfolio management can be brought to bear on managing the process • This includes uncertainty management • Portfolio/programme/project uncertainty management distinctions are a question of degree for present purpose, a process ‘driver’
Process ‘drivers’ and linked assumptions When looking at each phase in detail, what is involved is a function of process ‘drivers’, so we have to make assumptions for discussion purposes. Some key process drivers (and the related assumptions) are: - strategy / tactical level of the project (strategic) - perspective and motives (client wanting insight) - learning curve position (low down) • decisions of interest (shaping strategic plans for execution and delivery as per the assumed stage)
The ‘qualitative analysis’ part of the process in detail, considering it phase by phase, starting with the ‘basis of analysis’ part of the process
Define the project • This phase involves problem structuring ‘craft skills’, a key aspect of the modelling skills required by the person in charge of leading and shaping the process, the ‘process manager’ • All ‘process staff’ require interpersonal skills • The importance of using a simple strategic level activity (task) structure aligned with the nature of the risks involved • The need to move from a task orientation to an objectives orientation • The role of the 12 stage nominal project lifecycle • The role of the 7 Ws framework and the plan-criteria relationship structure
Key project definition questions – the seven Ws whichway who plans for relationships and contracts all project parties ultimately involved why when plans for business case purposes project motives: profit and other motives integration of all plan-based timetables what resource plans for operations plans for operations the design of the product of the project resource plans for activities plans for activities where - the location of the project and all the relevant wider context issues wherewithal
Define phase specific tasks start the process consolidate the project lifecycle the project context the project parties the project objectives the project design the whichway plans the wherewithal plans the project timing no elaborate and resolve deliverables fit for purpose? yes complete the focus phase
Four common tasks for all phases • document – record in text, tables and diagrams, with a view to ease of understanding for all parties involved • verify – ensure all providers of information agree as far as possible, and important differences of opinion are highlighted • assess – evaluate the analysis to date in context to ensure it is ‘fit for purpose’ • report – release verified documents and present findings as appropriate
A simple BCS example to compare with the offshore North Sea examples used to illustrate the define phase earlier
Focus the process • This phase involves ‘process design’ craft skills, a crucial aspect of modelling skills needed by the ‘process manager’ • Understanding what these ‘process design’ craft skills involve is a core requirement for those aspiring to manage the process • It is also crucial for decision takers – who have to trust their judgement when selecting advisors – to ensure that they have a clear idea what they are looking for in terms of ‘process design’ skills • A useful place to start to understand what is involved is an overview of the task structure for this phase
start the process scope the process Focus phase specific tasks plan the process clarify the process lifecycle clarify the process context select a process approach clarify the process parties determine resources required clarify the process objectives determine timing top-down uncertainty appreciation consolidate the process strategy to the Identify phase assess the process plan needs development satisfactory assess the process scope satisfactory needs development unacceptable unacceptable stop the project
Some of the objectives which may be relevant • Risk efficiency • Clarity efficiency • Opportunity efficiency • Opportunity management as the dominant goal • Culture change • Targets, expectations and commitments distinguished • Contingencies and provisions clarified and given clear owners • Bottom up communication encouraged, with a shared ‘big picture’ perspective • Creativity and satisfaction (fun) used as effective objectives
Key concerns which are often not addressed • What subset of these objectives is appropriate for this particular application of the generic process • How should the process be shaped to this subset of appropriate objectives • What are the other important drivers, like value at risk, project novelty, project complexity, time and resources available, learning curve position, lifecycle position, decisions of interest, and strategy/task level focus • Which of the 7 Ws is the focus, and how do the objectives of immediate interest relate to the plans which are most relevant • What are the most important questions which need addressing first