Download
1 / 13
130 likes | 299 Views
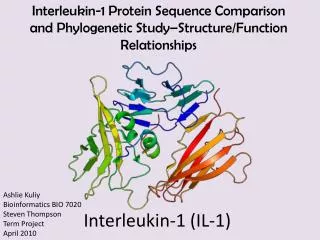
Modeling Cell Proliferation Activity of Human Interleukin-3 (IL-3) Upon Single Residue Replacements. Majid Masso Bioinformatics and Computational Biology George Mason University, Manassas, Virginia, USA BIOSTEC BIOINFORMATICS 2011. IL-3 Structure, Function, and Experimental Mutagenesis Data.

E N D
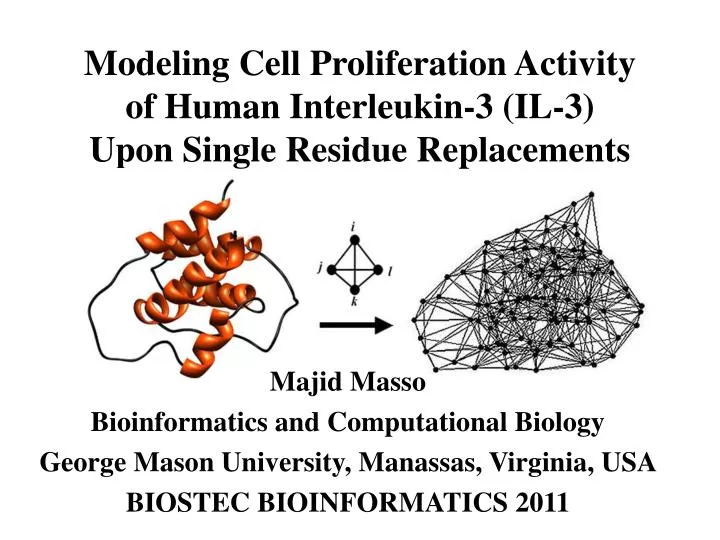
Modeling Cell Proliferation Activity of Human Interleukin-3 (IL-3) Upon Single Residue Replacements Majid Masso Bioinformatics and Computational Biology George Mason University, Manassas, Virginia, USA BIOSTEC BIOINFORMATICS 2011
IL-3 Structure, Function, and Experimental Mutagenesis Data • IL-3 promotes the growth of many hematopoietic cell lines • Theoretically, there are 19 × 112 = 2128 possible IL-3 mutants via single residue substitutions at all positions in the structure • Experimental dataset: 630 of these IL-3 mutants were synthesized, representing substitutions at all but 12 positions • Activity of synthesized IL-3 mutants measured as % of wild type (wt) using erythroleukemic cell proliferation assays: 27 “increased” mutants (>100% wt); 373 “full” (20 – 100% wt); 75 “moderate” (5 – 19% wt); and 155 “low” (< 5% wt) • Alternatively, there are 400 “unaffected” (“increased” + “full”) and 230 “affected” (“moderate” + “low”) IL-3 mutants
Cα coordinates Abstract every amino acid residue to a point Atomic coordinates – Protein Data Bank (PDB) A22 L6 D3 F7 G62 K4 S64 R5 C63 Delaunay Tessellation of Protein Structure Aspartic Acid (Asp or D) Delaunay tessellation: 3D “tiling” of space into non-overlapping, irregular tetrahedral simplices. Each simplex objectively identifies a quadruplet of nearest-neighbor amino acids at its vertices.
Delaunay Tessellation of Interleukin-3 (IL-3) • Ribbon (left) from PDB file 1jli (112 residues, positions 14 – 125) • Each amino acid residue is represented by its Cα in 3D space • Tessellation of the 112 Cα points (right) is performed using a 12Å edge-length cutoff, for “true” residue quadruplet interactions
… 1bniA barnase 1efaB lac repressor Pool together all simplices from the tessellations, and compute observed frequencies of simplicial quadruplets Four-Body Statistical Potential Training set: nearly 1,400 diverse high-resolution x-ray structures PDB Tessellate 3lzm t4 lysozyme 1rtjA HIV-1 RT
Computational Mutagenesis D21 14 simplices, 11 neighbors of D21 (large Cα point) IL-3 tessellation Residual profile vector Rmut of IL-3 D21S mutant environmental change (EC) Residual score = EC21
Feature Vectors for IL-3 Mutants • For IL-3 mutation at position N, nonzero EC scores in residual profile vector Rmut occur only at N and its structural neighbors • Every position has at least 6 neighbors, can be ordered based on Euclidean distance from position N (tessellation edge-lengths) • So, create new 7D vector: residual score (EC score at N), and EC scores of the 6 closest neighbors (ordered by distance from N) • 20 additional features: position number N, wt and replacement residues, residues at neighbor positions, primary sequence location of neighbors relative to N, mean tetrahedrality and volume of simplices using N, secondary structure at N, tessellation-defined depth of N, and number of surface contacts • Total: each IL-3 mutant represented as a 27D feature vector
Supervised Classification (unaffected/affected) • Algorithm: random forest (RF); Training set: 630 IL-3 mutants • Testing: tenfold cross-validation (10-fold CV), leave-one-out CV (LOOCV), and random split (2/3 for training, 1/3 for prediction) • Evaluation of performance: • Overall accuracy, or proportion of correct predictions: Q • Balanced error (accuracy) rate: BAR = 1 – BER • Matthew’s correlation coefficient: MCC • Area under ROC curve: AUC
Conclusion and Future Directions • Computational mutagenesis procedure effectively elucidates the IL-3 structure-function relationship (via residual scores) • Random forest predictive model for any mutational effect on IL-3 activity developed using attributes based on: • computational geometry (Delaunay tessellation of IL-3 structure) • computational mutagenesis (EC scores of residual profile vectors) • Current work focused on inductive learning, future project could apply transductive learning for predicting unknown mutants • The techniques can be applied to any similar experimental protein mutant dataset – motivation for robust wet-lab collaborations • Contact: mmasso@gmu.edu Slides available at: http://binf.gmu.edu/mmasso