Download
1 / 19
190 likes | 203 Views
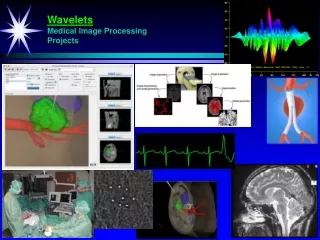
Process-, Work-Flow in Medical Image Processing. Guido Gerig http://na-mic.org. Need for Process Flow. Image Processing and Analysis: Sequence of processing steps (readers, filters, mappers, writers, visualization) Clinical studies: between 30 and x00 datasets

E N D
Process-, Work-Flow in Medical Image Processing Guido Gerig http://na-mic.org
Need for Process Flow • Image Processing and Analysis: • Sequence of processing steps (readers, filters, mappers, writers, visualization) • Clinical studies: between 30 and x00 datasets • Research: Prototyping Environment • Process Flow System: • Fully automated (batch) and/or user-guided • Guides user through processing steps • Improved reliability and efficiency • Relieves user from repetitive tasks • Simplified sharing of processing sequences • Process Flow System: Beyond Script Files (≠UNIX script/PERL/Python)
Example: User-Guided 3-D Level-Set Segmentation (SNAP) • 3D Snake Segmentation: • Preprocessing (features) • Initialization • Post-editing • User-guidance • Challenge: Use by non-experts • Tool: SNAP-ITK (Yushkevich, Ho, Gerig) 5years Project
Preprocessing Initialization Segmentation Level Set Segmentation Pipeline A wizard guides the user through the segmentation process
1 Region competitionstopping criterion(thresholding) 0 1 Intensity edgestopping criterion 0 -1 ITK-SNAP Tour: Preprocessing
Spherical ‘bubbles’ or a coarse manual segmentation are used to initialize the level set ITK-SNAP Tour: Initialization
Different user interfaces: Intuitive mode Mathematical mode Preview of the forces acting on the level set ITK-SNAP Tour: Parameters
T1 T2 Tissue Cortex Example: EMS-ITK: Atlas-based brain MRI Segmentation
Example: Hippocampus Shape Analysis Workflow Manual Landmarking Gray-value Normalization MRI Reformat SPHARM- PDM Shape Spherical Parameterization Hippocampus Segmentation via Model Deformation QC Shape & Corresp. Feature Computation e.g. Parcellation or Difference to Model Alignment & Scaling Prior Models QC of Features & Statistical Results Statistical Analysis Of Features
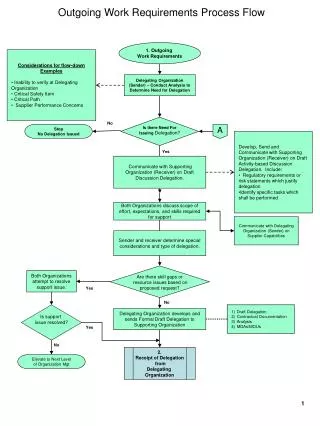
Example: DTI Analysis in large clinical study (N>100) • Co-registration of DTI • Registration of DTI of each subject with: • structural MRI • segmentation maps • lobe parcellation • user-defined ROIs • Statistical analysis per ROI Group 1 Group 2
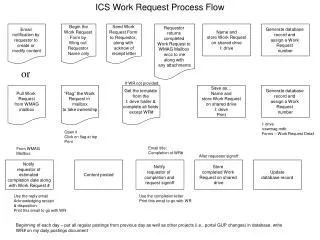
DTI processing pipeline 4 DTI shots (.dcm) dcm2hdr 4 DTI shots (.hdr) DTIChecker Average DTI (.gipl) gipl2GE Average DTI (GE format) TensorCalc FA/ADC maps (Gipl) Tensor field ROI and Lobe analysis Fiber Tracking analysis Analysis using Imagine Using the FiberTracking tool
DTI processing pipeline (ctd.) FA/ADC maps Co-registration sMRI (T1/T2/PD) EM-Segmentation ROIs Brain Lobe Atlas MRI atlas template Data Fusion Linear and nonlinear registration ROI and Lobe Analysis Writing Statistics
UNC Solution: IMAGINE(Matthieu Jomier) Download: http://www.ia.unc.edu/dev
UNC IMAGINE • Cross-platform • GUI-based visual programming environment • Command line applications integration: Add your own modules • Full integration ITK/vtk • Modules executed as thread • Memory manager: allocate/disallocate mem. • Visual feedback/log file • Generates Source code (C++) and makefile (Dyoxygen document.) • Generates stand-alone cross-platform software with GUI Imagine can generate Graphic User Interface automatically. Here, an example demonstrating the GUI generation for a recursive Gaussian filter.
“Imagine” & “Batchmake”(Matthieu & Julien Jomier) Parallel processing with BatchMake interface and script generation. With Batchmake, you can follow progress of your pipeline online
Demonstration Imagine 2 Toy Example: Data Fusion: • Registration of DTI to sMRI: • Registration T1 and T2/PD • Registration of baseline DTI-0 to T2 (linear, nonlinear) • Use transformation to register FA/ADC to T1/T2/PD
Discussion • Process Flow Architecture significantly improves efficiency of research / exchange / “time to market” / large-scale studies • Experience at UNC: Since introduction in ‘04, the ITK-based ProcessFlow environment has become standard tool (backbone) • NA-MIC: Four uses: • Process flow in dedicated tasks (level-set segmentation, DTI processing, shape analysis, segmentation, etc.) • Research environment to facilitate prototyping/ exchange/ comparison: Facilitates transfer of research tools to Core 2 • Clinical studies Core 3: • Process flow systems to set-up a proc. system for individual tasks • Run Batch jobs on large clinical studies → parallel/grid computing • Verify results via qualitative visualization • Training/Dissemination Core 5: Process flow systems with visual feedback are excellent for teaching of methodology and tools • Architectures: LONI Pipeline / AVS / SCIRun / UNC Imagine-1 and 2 / MevisLab / ….
Criteria • ITK- and NA-MIC toolkit users don’t need to program, does not require advanced programming skills • Cross-platform • Pipeline processing and visual programming environment • Easy integration, e.g. command-line integration of own modules • Facilitates tests/comparison/exchange even of complex software and whole systems • GUI generation, e.g. creation of stand-alone cross-platform software from Pipeline • Parallel Processing / Script Generation • Clinical studies: Multi-data processing • Desirable for clinical studies: Visual programming language structures like “for loop”, “if… then … else” and “do… while” functions