Download
1 / 1
10 likes | 146 Views
LC-ESI-MS/MS analysis of nine basic pharmaceuticals in influent, effluent and surface water Jet C. Van De Steene and Willy E. Lambert Laboratory of Toxicology, University Ghent, Harelbekestraat 72, B-9000 Gent, Belgium Jet.Vandesteene@ugent.be. Overview Analysis of nine basic pharmaceuticals:

E N D
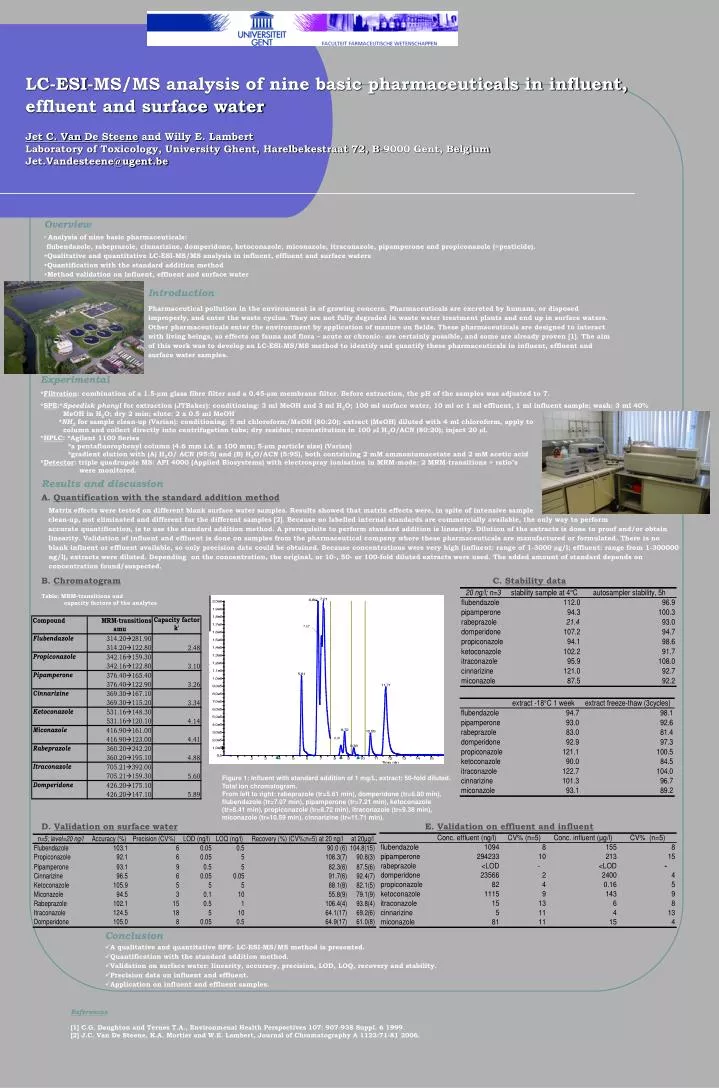
LC-ESI-MS/MS analysis of nine basic pharmaceuticals in influent, effluent and surface waterJet C. Van De Steene and Willy E. LambertLaboratory of Toxicology, University Ghent, Harelbekestraat 72, B-9000 Gent, Belgium Jet.Vandesteene@ugent.be • Overview • Analysis of nine basic pharmaceuticals: • flubendazole, rabeprazole, cinnarizine, domperidone, ketoconazole, miconazole, itraconazole, pipamperone and propiconazole (=pesticide). • Qualitative and quantitative LC-ESI-MS/MS analysis in influent, effluent and surface waters • Quantification with the standard addition method • Method validation on influent, effluentandsurface water Introduction Pharmaceutical pollution in the environment is of growing concern. Pharmaceuticals are excreted by humans, or disposed improperly, and enter the waste cyclus. They are not fully degraded in waste water treatment plants and end up in surface waters. Other pharmaceuticals enter the environment by application of manure on fields. These pharmaceuticals are designed to interact with living beings, so effects on fauna and flora – acute or chronic- are certainly possible, and some are already proven [1]. The aim of this work was to develop an LC-ESI-MS/MS method to identify and quantify these pharmaceuticals in influent, effluent and surface water samples. Experimental *Filtration: combination of a 1.5-µm glass fibre filter and a 0.45-µm membrane filter. Before extraction, the pH of the samples was adjusted to 7. *SPE:*Speedisk phenyl for extraction (JTBaker): conditioning: 3 ml MeOH and 3 ml H2O; 100 ml surface water, 10 ml or 1 ml effluent, 1 ml influent sample; wash: 3 ml 40% MeOH in H2O; dry 2 min; elute: 2 x 0.5 ml MeOH *NH2 for sample clean-up (Varian): conditioning: 5 ml chloroform/MeOH (80:20); extract (MeOH) diluted with 4 ml chloroform, apply to column and collect directly into centrifugation tube; dry residue; reconstitution in 100 µl H2O/ACN (80:20); inject 20 µl. *HPLC: *Agilent 1100 Series *a pentafluorophenyl column (4.6 mm i.d. x 100 mm; 5-µm particle size) (Varian) *gradient elution with (A) H2O/ ACN (95:5) and (B) H2O/ACN (5:95), both containing 2 mM ammoniumacetate and 2 mM acetic acid *Detector: triple quadrupole MS: API 4000 (Applied Biosystems) with electrospray ionisation in MRM-mode: 2 MRM-transitions + ratio’s were monitored. • Results and discussion • Quantification with the standard addition method • Matrix effects were tested on different blank surface water samples. Results showed that matrix effects were, in spite of intensive sample • clean-up, not eliminated and different for the different samples [2]. Because no labelled internal standards are commercially available, the only way to perform • accurate quantification, is to use the standard addition method. A prerequisite to perform standard addition is linearity. Dilution of the extracts is done to proof and/or obtain linearity. Validation of influent and effluent is done on samples from the pharmaceutical company where these pharmaceuticals are manufactured or formulated. There is no blank influent or effluent available, so only precision data could be obtained. Because concentrations were very high (influent: range of 1-3000 µg/l; effluent: range from 1-300000 ng/l), extracts were diluted. Depending on the concentration, the original, or 10-, 50- or 100-fold diluted extracts were used. The added amount of standard depends on concentration found/suspected. • B. ChromatogramC. Stability data • Table: MRM-transitions and • capacity factors of the analytes • Figure 1: Influent with standard addition of 1 mg/L, extract: 50-fold diluted. • Total ion chromatogram. • From left to right: rabeprazole (tr=5.61 min), domperidone (tr=6.80 min), • flubendazole (tr=7.07 min), pipamperone (tr=7.21 min), ketoconazole • (tr=8.41 min), propiconazole (tr=8.72 min), itraconazole (tr=9.38 min), • miconazole (tr=10.59 min), cinnarizine (tr=11.71 min). • D. Validation on surface water E. Validation on effluent and influent 7,07 8,41 • Conclusion • A qualitative and quantitative SPE- LC-ESI-MS/MS method is presented. • Quantification with the standard addition method. • Validation on surface water: linearity, accuracy, precision, LOD, LOQ, recovery and stability. • Precision data on influent and effluent. • Application on influent and effluent samples. References [1] C.G. Daughton and Ternes T.A., Environmenal Health Perspectives 107: 907-938 Suppl. 6 1999. [2] J.C. Van De Steene, K.A. Mortier and W.E. Lambert, Journal of Chromatography A 1123:71-81 2006.