Download
1 / 1
10 likes | 113 Views
D IRC, Particle Identification for B A B AR. D etection of I nternally R eflected C herenkov light

E N D
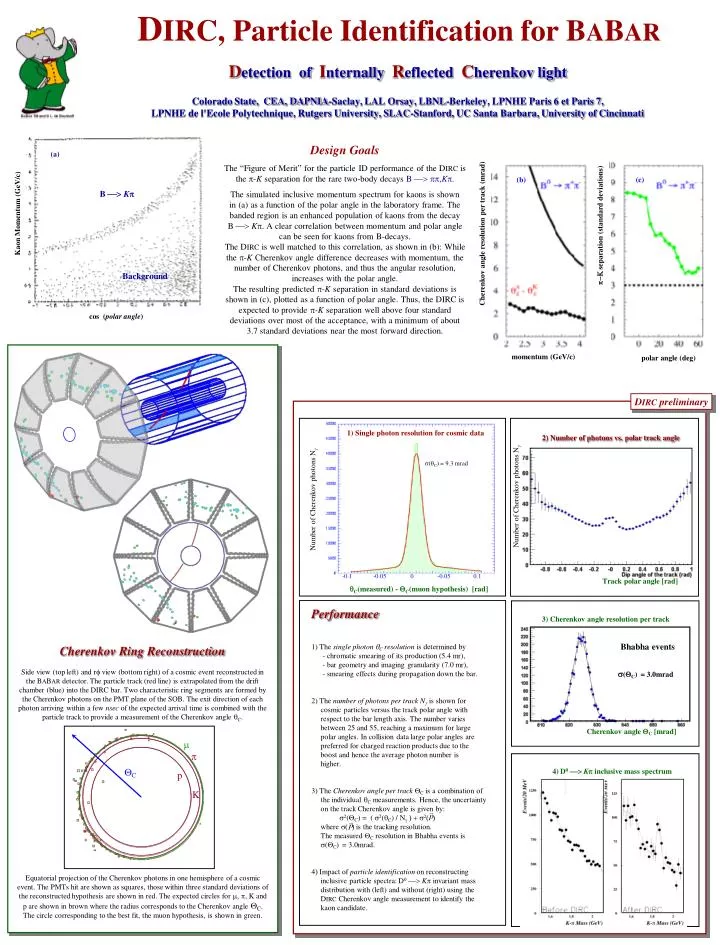
DIRC, Particle Identification for BABAR Detection of Internally Reflected Cherenkov light Colorado State, CEA, DAPNIA-Saclay, LAL Orsay, LBNL-Berkeley, LPNHE Paris 6 et Paris 7, LPNHE de l'Ecole Polytechnique, Rutgers University, SLAC-Stanford, UC Santa Barbara, University of Cincinnati Design Goals The “Figure of Merit” for the particle ID performance of the DIRC is the -K separation for the rare two-body decays B ,K. The simulated inclusive momentum spectrum for kaons is shown in (a) as a function of the polar angle in the laboratory frame. The banded region is an enhanced population of kaons from the decay B K. A clear correlation between momentum and polar angle can be seen for kaons from B-decays. The DIRC is well matched to this correlation, as shown in (b): While the -KCherenkov angle difference decreases with momentum, the number of Cherenkov photons, and thus the angular resolution, increases with the polar angle. The resulting predicted -K separation in standard deviations is shown in (c), plotted as a function of polar angle. Thus, the DIRC is expected to provide -K separation well above four standard deviations over most of the acceptance, with a minimum of about 3.7 standard deviations near the most forward direction. (a) (b) (c) B K Kaon Momentum (GeV/c) p-K separation (standard deviations) Cherenkov angle resolution per track (mrad) Background cos (polar angle) momentum (GeV/c) polar angle (deg) DIRC preliminary 1) Single photon resolution for cosmic data 2) Number of photons vs. polar track angle s(qC) = 9.3 mrad Number of Cherenkov photons Ng Number of Cherenkov photons Ng Track polar angle [rad] qC(measured) - QC(muon hypothesis) [rad] 3) Cherenkov angle resolution per track Performance 1) The single photon qC resolution is determined by - chromatic smearing of its production (5.4 mr), - bar geometry and imaging granularity (7.0 mr), - smearing effects during propagation down the bar. 2) The number of photons per track Ng is shown for cosmic particles versus the track polar angle with respect to the bar length axis. The number varies between 25 and 55, reaching a maximum for large polar angles. In collision data large polar angles are preferred for charged reaction products due to the boost and hence the average photon number is higher. 3) The Cherenkov angle per trackQC is a combination of the individual qC measurements. Hence, the uncertainty on the track Cherenkov angle is given by: s2(QC) = ( s2(qC) / Ng ) + s2( )where s( ) is the tracking resolution.The measured QC resolution in Bhabha events is s(QC)= 3.0mrad. 4) Impact of particle identification on reconstructing inclusive particle spectra: D0K invariant mass distribution with (left) and without (right) using the DIRC Cherenkov angle measurement to identify the kaon candidate. Bhabha events Cherenkov Ring Reconstruction Side view (top left) and rf view (bottom right) of a cosmic event reconstructed in the BABAR detector. The particle track (red line) is extrapolated from the drift chamber (blue) into the DIRC bar. Two characteristic ring segments are formed by the Cherenkov photons on the PMT plane of the SOB. The exit direction of each photon arriving within a few nsec of the expected arrival time is combined with the particle track to provide a measurement of the Cherenkov angle qC. s(QC)= 3.0mrad Cherenkov angle QC [mrad] mp 4)D0K inclusive mass spectrum QC p -0.1 -0.05 0 -0.05 0.1 K Equatorial projection of the Cherenkov photons in one hemisphere of a cosmic event. The PMTs hit are shown as squares, those within three standard deviations of the reconstructed hypothesis are shown in red. The expected circles for m, p, K and p are shown in brown where the radius corresponds to the Cherenkov angle QC. The circle corresponding to the best fit, the muon hypothesis, is shown in green.