Download
1 / 28
280 likes | 477 Views
Application of modelling in the assessment of control measures to reduce diffuse pollution. Dr Kevin Hiscock School of Environmental Sciences University of East Anglia Norwich, UK (E-mail k.hiscock@uea.ac.uk) Acknowledgement: Han Zhang

E N D
Application of modelling in the assessment of control measures to reduce diffuse pollution Dr Kevin Hiscock School of Environmental Sciences University of East Anglia Norwich, UK (E-mail k.hiscock@uea.ac.uk) Acknowledgement: Han Zhang Funding: Chinese Scholarship Council & University of East Anglia
OUTLINE of PRESENTATION • To demonstrate the objective use of groundwater flow and nitrate transport models in the assessment of diffuse pollution control measures • To estimate the amount of land-use change needed to meet groundwater standards • To assess the impact of land-use change on groundwater quantity (groundwater recharge and groundwater level) • To compare arable land conversion to woodland with other agricultural management practices such as cover crops and fertiliser reduction
Background to nitrate pollution Groundwater quality(nitrate) Nitrate concentration in drinking water < 50mg/l (Water Framework Directive 2000/60/EC)
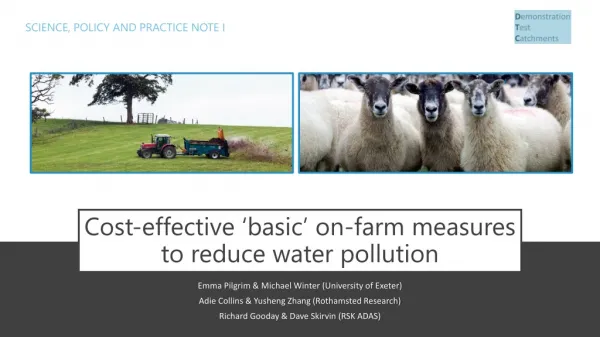
Increasing woodland as a land-use change strategy for controlling diffuse pollution • Current UK government policy (The England Forestry Strategy, Regional Forestry Frameworks, Community Forests Partnerships, Farm Woodland Premium Scheme) aims to increase woodland cover (currently only 8.5% in England) • NVZ - Nitrate Vulnerable Zones • Pilot case studies • Water4all Project Lincolnshire Limestone • Afforestation Denmark, Germany Give N reduction potential
Increase woodland, less recharge, water shortage? • Conversion from arable land to woodland • may reduce groundwater recharge and lead to fall of the groundwater table as trees tend to consume more water than other vegetation (Bosch & Hewlett 1982; Blackie 1993, Sahin & Hall 1996; Calder 2003) Recharge volume: pine forest < oak woodland < grasslandTrees and Drought Project of Lowland England (TaDPoLE) • may aggravate the problem of water shortages due to reduced recharge under forest cover (Farley 2005; Bending 1997; Calder 2000; Finch 2001) • the recharge of groundwater beneath broadleaved woodland and grass sites in a Chalk aquifer study was almost the same(Roberts, 2006)
Tools and Methods • ArcGIS – ArcMap (Land-use type and area) • Recharge model – vegetation water requirement • Visual MODFLOW v4.1 – groundwater flow model • Export coefficient model – nitrogen load and leaching • MT3DMS – nitrate transport model • MODPATH – define abstraction borehole capture zones
Export coefficient N Input LCM N Losses GW Recharge Recharge Model Leachate concentration GW Flow modelling Mass transport modelling MT3DM MODFLOW Scenario predictions Tree species conversion PATHLINE Land-use change Agricultural management Approach and modelling strategy
Location map of the study area • West Nottinghamshire, • East Midlands • Area: 50 km N-S ×30 km W-E • Sherwood Sandstone aquifer • Sandstone dips eastwards at about 1 in 50 • In the east, low-permeability • mudstone overlies the sandstone Idle Poulter Ryton Meden Maun Greet Dover Severn Trent Mudstone Sandstone
Land-use map (LCM2000) Arable agriculture covers approximately 75% of outcrop area and receives large quantities of nitrogen (e.g. manure and fertiliser applications to crops)
Nitrate concentration in abstraction boreholes (Unconfined aquifer, data source Severn-Trent Water, year 2007) (mg/l)
Groundwater Flow Modelling • Criteria for model calibration • groundwater levels in 27 observation boreholes (Environmental Agency) • River flows at 10 river gauging stations (National River Flow Archive) • Particle-tracking • MODPATH: using calibrated GW model to generate capture zone of abstraction borehole
Modelled GW level vs. Observed GW level in 1986-2006 Well 1729 DUCHESS PLANTATION Well 1722 CROSSLEY HILL Well 1793 CLIPSTONE FOREST Well 1740 KIGHILL
GW pathline calculation to determine capture zones Budby Budby Forest
Nitrate Transport Model Nitrate concentration recharge Nitrogen losses- Export coefficient modelling GW recharge Nitrate concentration Criteria for nitrate transport model nitrate concentrations at 24 groundwater monitoring points (EA) / groundwater abstraction boreholes (STW) Nitrate concentration = Nitrogen losses / GW recharge
Modelled nitrate distribution and N losses in 2006 0 20 30 40 50 60 mg/l N kg/yr/cell
Modelled and observed groundwater nitrate concentrations BOUGHTON 2 AMEN CORNER 2 PAPPLEWICK BURTON JOYCE (confined)
Modelled and observed nitrate concentrations (Forest areas) CLIPSTONE FOREST 3 BUDBY FOREST 1
Model application to scenario prediction • Tree species conversion Conifer Broadleaf Broadleaf Conifer • Land-use Change Arable lands Woodland Arable lands Unfertilised grassland • Land management practices Cover crops in winter Fertiliser reduction
Prediction 1: Effect of tree species conversion on GW 1 Changes of GW recharge (%) and water level (cm) 2 3
Arable 27.7% Arable ? Grass 15.2% Grass 15.2% Conifer 20.2% Conifer ? Broadleaf ? Broadleaf 19.8% Other 17.1% Other 17.1% 99.75 mg/l 89.14 mg/l 9250 kg N/yr 50 mg/l 11935 kg N/yr 62.21 mg/l Prediction 2: Effect of land-use change on GW Estimation of proportion of woodland (Far Baulker) N Losses Soil Leachate NO3- GW NO3-
Estimation of area of land-use change required to meet 50 mg/l groundwater nitrate (Far Baulker)
Effect of land-use change on GW nitrate concentration(Far Baulker)
Prediction 3: Effect of Agricultural Practices on GW Cover Crops To be applied on spring cultivated cereals, set-aside, horticultural crops Not to be applied on winter cereals, sugar beet and potato crops
Conclusions • Groundwater flow and nitrate transport models can represent historical data appropriately • Borehole capture zones generated by a calibrated groundwater model can be used to propose land-used change scenarios • Calibrated models can be used to assess the effect of land-use change on both groundwater quantity and quality • Tree species conversion in specified model cells did not greatly affect groundwater level, although recharge reduction occurs as a result of conifer replacing broadleaf forest • Land-use change has more effectiveness in controlling nitrate pollution than agricultural management practices used in isolation