Download
1 / 24
251 likes | 593 Views
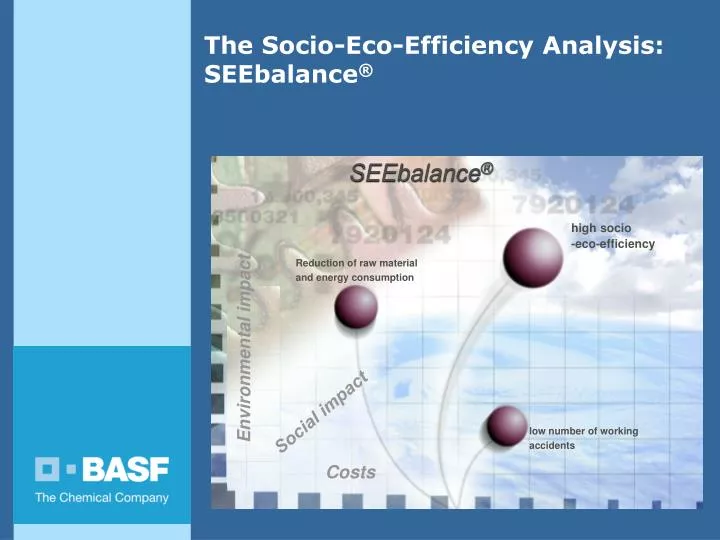
The Socio-Eco-Efficiency Analysis: SEEbalance ®. SEEbalance ®. high socio -eco-efficiency. Reduction of raw material and energy consumption. Environmental impact. Social impact. low number of working accidents. Costs. The Four Strategic BASF Guidelines for Long-term Success.

E N D
The Socio-Eco-Efficiency Analysis: SEEbalance® SEEbalance® high socio -eco-efficiency Reduction of raw material and energy consumption Environmental impact Social impact low number of working accidents Costs
The Four Strategic BASF Guidelines for Long-term Success Help ourcustomers to bemore successful Earn apremium on ourcost of capital Ensuresustainabledevelop-ment Formthe best teamin the industry
The Three Pillars of Sustainable Development Sustainable Development ecology society economy SEEbalance®-Analysis Eco-EfficiencyAnalysis
Universität Karlsruhe (TH) Institut für Geographie und Geoökologie Development of SEEbalance® From the Eco-Efficiency Analysis to the SEEbalance® • aim: Integration of quantifiable social indicators in the BASF eco-efficiency analysis • schedule: starting point 2001 end point March 2005 • this subproject was a part of the BMBF project „Sustainable Chemistry of Aromatics“ co-operation partners for the development of the SEEbalance® were:
What is an Socio-Eco-Efficiency Analysis (SEEbalance)? • Method for the comprehensive assessmentof products and processes. • Ecological and economic and social aspects are given equal weight in assessments. • The products are analyzed from the angle of the end customer. • (Future) scenariosand effects of various action options are presented. • Eco-efficiency analysis is a standard tool in the BASF Group; more than 240 analyses have been carried out (about 15 SEEbalance).
SEEbalance® Results: Men‘s Shirts • This analysis includes in the social assessment the stakeholder employees, consumers, national community and future generations. • The 100% polyester shirt is a hypothetical shirt considered only for comparison and is not frequently encountered in the market. User benefit alternative Comparable alternatives Wearing a blue men‘s shirt (40 times) 100 % cotton shirt 100% polyester shirt (PET) blended fabric shirt (65% cotton, 35% PET)
Cotton Blended fabric PET Results:Base Case: Blue Men‘s Shirts Wearing a blue men‘s shirt (40 times) 0,75 0,75 envirnonmental burden 1,00 environmental burden 1,00 1,25 1,25 1,00 0,75 costs 0,75 0,75 1,25 1,00 1,00 costs social influence 1,25 0,75 1,00 social influence 1,25 0,75 1,25 1,00 costs
25%employees 15% working accidents 20% fatal working accidents 30% employees 60% toxicity potential 15% occupational diseases 15% qualified employees 20%consumer 40% other risks and product characteristics 25% toxicity potential + transport 15% gender equality 10% wages and salaries 10% integration of disabled people 20% local & national community 10% professional training 15% part-time employees 25% number of trainees 5% strikes and lockouts 15% family support 20% future generation 25% R&D (company expenditures) 50% child labour 25% capital investments 15% international community 25% foreign direct investment 25% social security 25% imports from developing countries Weighting FactorSurvey in Germany
1,0 0,5 0,0 Analogies between Ecological and Social LCA Ecological LCA Social LCA Potential impact of product or processes on natural capitale. g. - energy consumption - global warming potential (GWP) What is to be assessed? Potential impact of product or processes on human/social capital e. g. - consumer - future generation 1st : Inventory analysis (inputs/ outputs) 2nd: Impact assessment for defined indicators e. g. GWP: 11 CO2-equivalent per UB 1st : Inventory analysis (inputs/ outputs) 2nd: Impact assessment for defined indicatorse. g. employees: 3 working accidents per UB Ökologischer Fingerprint • Social Fingerprint Aggregation and presentation of results Ecological Fingerprint Employees Energy consumption 1,0 Internationalecommunity 0,5 Consumer alternative 1 UB = user benefit Area use Emissions 0,0 alternative 2 Local & national community Future generation Raw material consumption Eco-toxicity potential
employees 1,00 0,50 future generation consumer 0,00 national community cotton polyester blended febric Results:Social Fingerprint • The social fingerprint shows the social influence of a product or process according to the weighting factors
45 45 45 40 40 40 35 35 35 30 30 30 25 25 25 20 working accidents / 1 million CB 15 20 20 10 15 15 5 10 10 0 5 5 polyester shirt cotton shirt blended fabric 0 0 polyester shirt cotton shirt cotton shirt blended fabric blended fabric material manufacture yarning und weaving water supply energy and transportation confection cultivation cotton upgrading Results:Employees: Working Accidents • The graph shows that the cotton shirt manufacture causes about four times more working accidents than the polyester shirt manufacture. • The accidents occur primarily during cotton cultivation, since this step is very labour – intensive. • Many accidents are caused by the use of pesticides.
Normalization factor • Question: To which extent does the product contribute to the socialproblem on a national level? • Character: objective • Source: • To be calculated fromnational statistics • Weighting factor • Question: • How serious is the social problemcompared to the others?(probability, extent and duration ofconsequences) • Character: normative, subjective • Source: • polls (among experts or stakeholders) X = total assessment factor Assessment Scheme for Social Criteria Source: Schmidt
Course of Action • The SEEbalance® will be used as an official tool for life cycle assessment in the eco-efficiency group • Boosted external communication and public relations • In the future 10 – 20 % of all studies will be SEEbalances®
„Social profile“ of 1000 t of polyester (analogous to eco-profile) How Does SEEbalance ® Work? • 1st step: Search for the economic sector of the product e.g. polyester: sector “production of polymers” (NACE 24.16) • 2nd step: Search for the entries in the social LCA database • e.g. Production of polymers (NACE 24.16): • Working accidents: 0.058 accidents / 1000 t • Number of employees: 9,9 employees / 1000 t • ... (all other indicators) • 3rd step: Multiply specific social profile with the product quantities
Industries Goods CPC ISIC Worldwide (UN) CPA NACE EU-Level national version NACE(e.g. WZ) national version CPA (e.g. GP) National Level NACE - International Compatibility • Related classifications in more than 140 countries • Limited compatibility with NAICS (Canada, USA, Mexico) Source: Eurostat 2003
NACE - The EU-Classification of Industries Sectors Industries A, B Agriculture and forestry , fishing C, D, E Manufacturing industry F Construction Commerce, hotel trade, transports G, H, I Financial industry, enterprise services J, K L-Q Public and private services
Level Code Example “1-letter” A-Q D Manufacturing industry “2-letters” CA-DN DG Chemical industry “2-digit” 01-99 24 Chemical industry “3-digit” 01.1-99.0 24.1 Production of basic chemical goods “4-digit” 01.11-99.00 24.16 Production of polymers NACE – Hierarchical Levels
Life Cycle of the Cotton Shirt production use disposal mining of raw materials fertilzer/ pesticides raw materials sum of all transports MSWI cultivation of cotton and transports agents retail cleaning/ 40 times yarning confection weaving ironing upgrading collection of old clothing production of chemicals for textiles dyeing wearing of the shirt production in China Not included because the impact for all alternatives are equal
0,75 Increasing socio-eco- efficiency Environmental burden 1,00 Decreasing socio-eco efficiency 0,75 1,25 1,00 1,00 social influence costs 1,25 0,75 alternative 1 alternative 2 SEECube®
Placement of the SEEbalance® „cradle-to-gate“ ...from raw material to factory gate „cradle-to-grave“ ... including use and recycling eco-profile „cradle-to-grave and costs“ ... including all life cycle costs LCA „cradle-to-grave, costs and social aspects“ ... including social aspects eco-efficiency SEEbalance®
Aims of the SEEbalance® 1. „Quality-of-life“: Improvement of objective living conditions Improvement of subjective well-being 2. „Social Cohesion“: Reduction of disparity and social exclusion Fortification of social bonds and coherence 3. „Sustainability“: Intergenerational fairness International responsibility (intergenerational fairness) According to the system of GESIS/ ZUMA 2001
Due to the child labour in NIKE sneaker production, a compaign which proclaimed an Anti – Nike day was started (May 2001). Reasons for the development of the SEEbalance® Kölsch: Darf man das LOGO von Nike verwenden? Negativ Werbung!!! Integration of the third pillar of sustainability Increasing pressure on part of society Supposed hormonal effects of phthalates (plasticizer) in children’s toys resulted in disappearance from the market even though no scientitic proof existed Acceptance by the customer is imperative for the purchase of a product Taste of packaged food, e.g. sausages TV – enclosure with flame retardant
Internal • Strategy • Comparison of production sites • Comparison of markets • Marketing • (social) acceptance of the product (projects: sausage -study, redevelopment of residential area) External Application of the SEEbalance® • Profit: • secure decisions about products • and markets • communication • on coperate level • on product level • has an established and quantifiable • basis • (e.g. for coperate reports)
Procedure define customer benefit identify products / processes establish life cycle society ecology economy determination of social profiles for each step determination of eco-profiles for each step determination of costs for all life cycle segments aggregation of stakeholder effects aggregation of the effects categories calculation of total life cycle costs normalization of social effects normalization of environmental impact normalization of costs create SEECube®