Download
1 / 46
460 likes | 464 Views
An introduction to Microbial Oceanography Microbial photoautotrophy Ricardo M Letelier. Outline: Evolution and Diversity Photosynthesis light and dark reactions Measuring techniques Photo-aclimation and adaptation Expanding the concept of marine phototrophy

E N D
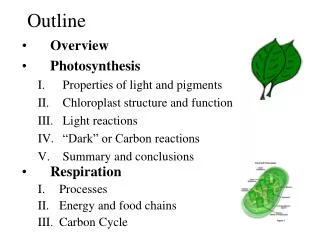
An introduction to Microbial Oceanography Microbial photoautotrophy Ricardo M Letelier • Outline: • Evolution and Diversity • Photosynthesis light and dark reactions • Measuring techniques • Photo-aclimation and adaptation • Expanding the concept of marine phototrophy • Some present and future challenges 2008 Center for Microbial Oceanography: Research and Education (CMORE) Summer Course
Global Heat Engine • Solar energy impinges on Earth unequally • Most insolation at the equator • Large temperature gradients between equator and Poles • Air & ocean movements controlled by temperature gradient • Net transference of heat from equator to poles.
Sabine et al. (2002) The distribution of DIC and nutrients in the ocean is principally determined by the combined effects of: - Biology (photosynthesis and respiration) and - Physics (gravity, water mass displacement, diffusion) - Chemistry
Atmospheric evolution of the O2 and CO2 partial pressure Archean OceanPhanezoic Ocean Chemical low O2 higher O2 Composition 1 mM Fe2+ 2-100 pM Fe2+ 1 mM Mn2+ 2-3 nM Mn2+ high S2- high SO42- Cu2S ppt Cu low fixed N higher NO3_______________________________________________ Existent cyanobacteriacyanobacteria Phytoplankton prasinophytes charophytesdinoflagellatesdinoflagellates diatoms haptophytes chrysophytes Comparison of the ocean chemistry between the Archean and Phanerozoic
Physiological changes originated through the evolution of an aerobic environment O2 derivatives: singlet oxygen peroxide superoxide anion radials hydroxide radicals Protective mechanisms: carotenoids (zeaxanthin) OH scavengers superoxide dismutase (Fe and/or Mn) peroxidase (Fe) catalase (Fe) Metal e- carriers Fe ______________________________________________ Oxidation of Fe2+, Mn2+ and S2-: virtual depletion of the reduced forms by phanezoic
Subsequent evolution of photoautotrophs: Alternate transition metals used superoxide dismutase with Cu and Zn (charophyceae) Aerobic respiration (instead of anaerobic with S2- as terminal e- acceptor) Cyanobacteria use cytochrome c (Fe) for e- transport (in the absence of Cu) If Cu is present then synthesis of plastocyanin is induced. Aerobic respiration in eukaryotes uses cytochrome oxidase (Cu).
12-16 major groups, 2 dominant, 4 frequent ClassesCommon Names Bacillariophyceae diatoms Dinophyceae dinoflagellates Prymnesiophytes coccolithophorids (Haptophyceae) Cyanophyceae cyanobacteria Prochlorophyceae prochlorophytes various nanoflagellates
Distinguishing features: sizes and shapes linear dimensions (1 m - 1mm) cell volume (4-5 orders of magnitude) flagella (presence, number, evenness, mastigonemes) cell wall cell organelles (shape and type) pigments storage products molecular markers (from Larkum and Vesk, 2003)
Molecular Phylogeny based on rRNA Sequences: • - Prokaryote 16s rRNA • - organelle 16s rRNA • - eukaryotes 18s rRNA & 80s ribosomes • Other Molecular techniques: • - HPLC pigments • - Inmunofluorescence antibodies • RNA & DNA probes • - Metabolites (from Raven, J. Phycol. 2005)
Energy capture, electron transport, and energy transduction (Light Reaction) • The photosynthetic process is carried out by a set of complex protein molecules that are located in and around the membrane. • Energy drives a series of reactions that transform light energy into chemical energy. • Oxygenic photosynthesis produces O2. However, we also have anoxygenic photosynthesis that does not produce O2 Energy of electrons
The electrons passing through thephotosystems derive from water P700* P680* ferredoxin Primary Acceptor Qa Qb 2 photons 2 photons PQ NADP Cytochromes b6f Energy of electrons PC P700 2e P680 H2O ½O2 + 2H+ photosystem 2 photosystem 1
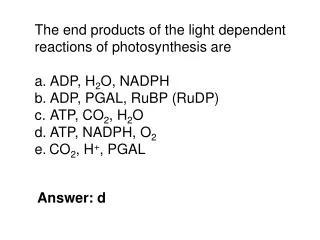
Final result • H2O + NAD(P)+ 1/2 O2 + NAD(P)H + H+ • The reaction requires: 26 Kcal per e- • 220 kJ per mol • However, once the electron reaches the ferredoxin, the electron pathway • becomes branched, enabling redox free energy to enter other metabolic pathways • in the chloroplast. • - transfer of electron to nitrite reductase • - glutamate synthase • - thioredoxin reductase • - PSI cyclic electron flow • Mehler reaction (pseudo cyclic electron flow) that leads to reduction of • molecular oxygen
Photophosphorylation and the chemiosmotic coupling hypothesis Postulated by Peter Mitchell in 1961 Nobel price in chemistry in 1978 An artificial pH gradient is set up across the thylakoid membrane, leading to the fomation of ATP in darkness pH 4 pH 4 H+ change medium H+ H+ ADP + Pi ATP H+ H+ H+ incubate pH 7 pH 4 H+ pH 4 H+ H+ H+ H+ H+ H+ pH 8
The Light Reactions: • Light absorption takes place in an “Antenna” made of photosynthetic pigments • Pigments funnel energy to a central pigment (a Chlorophyll a, embedded in a photosynthetic membrane) known as the Reaction Centre (RC), • Energy is then used to liberate an electron from the RC • This electron is then transferred from protein to protein along the “Electron Transport Chain”, losing energy and moving protons across the membrane • Finally the electron is used to reduce NADP+ to NADPH • The protons are used to produce ATP via the enzyme ATPase
In the electron transfer process the redox free energy is converted in two forms of energy: i) A chemical potential (pH gradient across the membrane) created by: - release of protons during the oxidation of water by PSII - the translocation of protons from the stroma and the lumen by the coupled reactions of PSII and the bf complex. Result DpH = pHin – pHout ii) An electric potential across the membrane that is created by - primary charge separation at the reaction center - charge transfer by the cytochrome b6f complex (these reactions transfer uncompensated charge across the photosynthetic membrane) Result Transmembrane electric potential (ΔΨ=Ψin-Ψout) Together, these two forms of energy make up the proton electrochemical potential (ΔμH+)
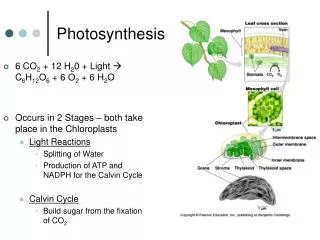
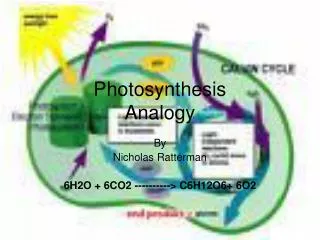
Photosynthetic Carbon Reduction Cycle (PCRC) Calvin-Benson cycle or C3 pathway CO2 + 2 H2O + 8 photon CH2O + H2O + O2 Using NADPH and ATP CO2 + 2NADPH + 2H+ + 3ATP CH2O + 2 NADP+ + 3 ADP + 3 Pi from 2H2O + 2NADP+ + 3ADP + 3Pi + 8 photon O2 + 2NADPH + 2 H+ + 3ATP
RuBPc (Ribulose biphosphate carboxylase) MW = 500,000 Not overly adaptative for fixing CO2 At CO2 ~ 10 mM and O2 ~ 250 mM In air equilibrated solution RuBPc/ RuBPo = 5 RuBPo is part of photorespiration, runs counter to reductive carboxylation, consumes energy and requires additional enzymes. Problems are intensified by depletion of CO2 in cell and Production of O2
Factors limiting BuBPc activity CO2 availability Fick’s law: Jbs = D dC/dl ATP and NADPH availability Raven (1984)
H2CO3 H+ + HCO3- HCO3- H+ + CO32- H2O + CO2 H2CO3 OH- + CO2 HCO3- Rapid relative to biological Interactions with the inorganic C cycle Slow relative to biological C assim. (carbonic anhydrase is used) Ribulose-1,5 –biphosphate (RuBP) carboxilase only used CO2 as substrate
Evidence for active uptake of CO2 “carbon concentrating” mechanisms Thalassiosira Pseudonana grown at 250 mM DIC 700 mM DIC 1250 mM DIC 1730 mM DIC 2000 mM DIC 2300 mM DIC
Measuring photosynthetic rates in marine microbial assemblages • Oxygen evolution in light and dark incubation bottles • 14C or 13C incorporation rates • Variable Fluorescence approach
Fluorescence Dissipation of excess energy Blue light induced chlorophyll fluorescence in Tobacco leaf. A. photographed in white light. B. taken in the low steady state of fluorescence, 5 min after the onset of illumination. The bright red fluorescing upper part of the leaf is where photosynthesis has been blocked by the herbicide duiron (DCMU). (From Krause and Weis, 1988) u e- PSI LHC (ATP & NADPH2) L683 heat u DCMU LHC PSI (ATP & NADPH2) Fp + Ff + Fh = 1 L683 heat
Fast Repetition Rate (FRR) fluorometry From Huot (2005) ETR = E0 x sPSII x nPSII x [chl a] x qPx (Fv/Fm)/0.65 How does in situ ETR compare to 14C or O2 derived photosynthetic rates?
Relationship between ETR, Gross Oxygen Evolution (GOE) and Carbon Fixation FETR ≈ FGOE > FCfix
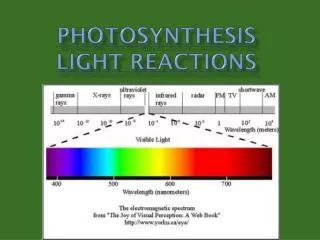
How does environmental variability affects photosynthesis and microbial photoautotrophic assemblages in marine environments? • Irradiance intensity decreases with depth • Spectral quality also changes with depth and particle load Light flux, mol quanta m-2 s-1 E(z) = E(0) e-kd z Depth, m
Light variability in the Deep chlorophyll maximum at Station ALOHA Karl et al. 2001
Temporal scales of aclimation and adaptation From J. Allen, 2002
Changes in absorption cross sections as a result of increase [chl a] under low light condition
Photoadaptation mechanisms: • Xanthophyll cycle: Involves the de-epoxidation of specific carotenoids, lowering the excitation state from a transferring level to a receiving level allows the thermal dissipation of excess energy. • State transition: Allows the redistribution of energy from the LHC to PSII or PSI • RuBisco or nitrate reductase activation/deactivation • Changes in antennae size and/or density of RC. • Changes in growth rates (controls of balanced growth rates)
Effect of increase in photosynthetic units on The PvsE relationship Effect of increase LHC on The PvsE relationship From B. Prezelin, 1981
Effect of decreasing RuBisco activity on the PvsE relationship Effect of LHC uncoupling (state transition) on the PvsE relationship
Depth succession in microbial assemblages Vertical distribution of the HL- and LL-adapted Prochlorococcus 16S rDNA genotypes in two different water columns in the eastern North Atlantic, revealed by dot blot hybridization. West & Scalan 1999
Expanding the range of light energy use by marine microbes • OP: oxygenic phototrophy • AnAnP: anaerobic, anoxygenic phototrophy • AAnP: aerobic anoxygenic phototrophy • RH: rhodopsin-based phototrophy • PC: phytochrome-based phototrophy Karl 2002, Nature 415: 590-591
Evidence for proteorhodopsin based phototrphy Walter et al. 2007, PNAS 10.1073/pnas.0611035104 Béjà et al. 2001, Nature 411: 786-789
Absorption and transients of proteorhodopsin in SAR-11 -633 nm Transient are positive and represent the increase in O populations. - 488 nm transient are negative and represent the depletion of PR populations. - Probe light at 530 nm
But can we prove that proteorhodopsin is used to generate proton gradients driving ATP synthesis? Walter et al. 2007, PNAS 10.1073/pnas.0611035104
1% I0 0,1 % I0 Vertical distribution of picoplankton as a function of O2and light Ulloa & De Pol (2004).
How does oxygen depletion affect photosynthesis in these regions? From Ulloa et al., unpublished STOX Oxygen Electrode
Some present and future challenges: • Are we done discovering new taxa and pathways? • - Do we understand the fluctuating environment experienced by microbes and their scale of response? • How do we characterize the breath of microbial phototrophy and its ecological role? • How do we develop and integrate new technologies in marine phototrophy research?