Download
1 / 17
170 likes | 376 Views
A Tale of Two Buildings Geothermal Technologies Workshops Redwood Falls, MN Mar 17-18, 2008 Sioux Falls, SD Mar 20-21, 2008 Westminster, CO June 10-11, 2008 Everett, WA Aug 11-12, 2008 Guy Nelson, Team Leader Utility Geothermal Working Group Palo Alto, CA Oklahoma City, OK

E N D
A Tale of Two Buildings Geothermal Technologies Workshops Redwood Falls, MN Mar 17-18, 2008 Sioux Falls, SD Mar 20-21, 2008 Westminster, CO June 10-11, 2008 Everett, WA Aug 11-12, 2008 Guy Nelson, Team Leader Utility Geothermal Working Group
Palo Alto, CA • Oklahoma City, OK PROJECT RESULTS FROM: A “side by side” Comparison of a Ground Source Heat Pump System vs. Conventional HVAC System between two “identical” buildings.
Testimony of a Building Owner “We have always dealt with hassles short term. What is valued now is looking at the long term hassle of the decisions we make with a short term attitude.” Brion McDonald, President, Universal Building Systems
Oklahoma City Buildings Conventional 15,000 sq ft GHP 20,000 sq ft Conventional Roof Top VAV Building Built in 1987 GHP Building Built in 1997 40 boreholes drilled 250 feet deep on 20 foot centers and 3/4 inch PE pipe 16 Ceiling Mounted Units
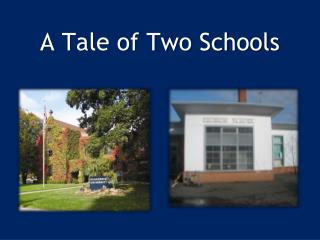
2183 and 2185 Park Blvd Buildings • Two Stories • 10,000 sq ft each • Built in the 1960s
GHP Non-Energy Benefits • Space Requirements • Noise • Maintenance • Ambient Conditions • Bigger than a bread box
GHP Capacity Benefits Assumption – 1/2 kW per home peak capacity savings from a 3 ton GHP system Wholesale Capacity Cost - $ 10 per kW month 20 year system life Net Present Value ??????????
GHP Capacity Benefits Net Present Value • 3% - $ 1788 • 5% - $ 1400 • 7% - $ 1272
US EPA Data • A typical 3-ton (10.5kW) residential GHP system produces an average of about one pound less CO2 per hour of use than a conventional system • 100,000 homes converted to GHPs would reduce annual CO2 emissions by 125,000 tons per year • 1.25 tons/yr per home http://www.nd.gov/dcs/energy/pubs/renewable/geoben.pdf
Contact Information Guy Nelson, UGWG Team Leader 541-994-4670 Gnelson181@aol.com