Download
1 / 56
610 likes | 954 Views
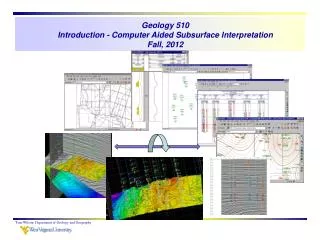
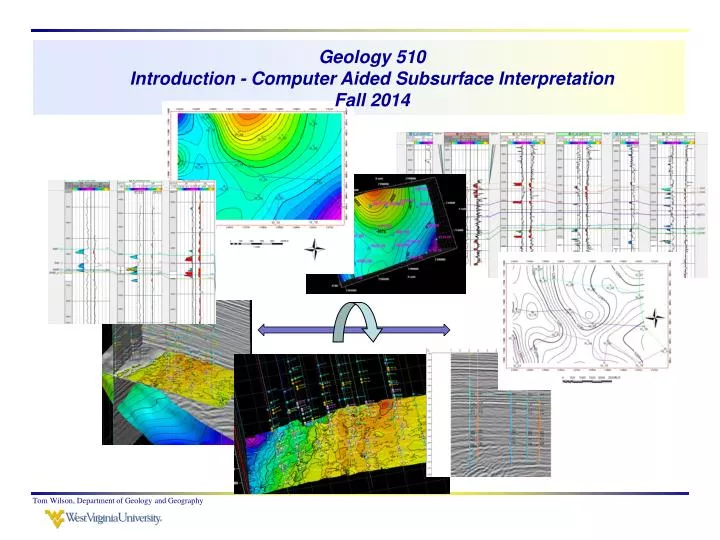
Geology 510 Introduction - Computer Aided Subsurface Interpretation Fall 2014. Note that power point slides are on the class web site at http://www.geo.wvu.edu/~wilson/geol510.htm. Instructor: Tom Wilson Office & Hours: rm 231 Brooks Hall, 10 to 11W, drop-ins welcome

E N D
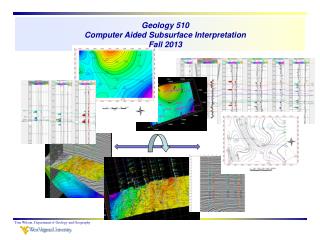
Geology 510Introduction - Computer Aided Subsurface InterpretationFall 2014 Tom Wilson, Department of Geology and Geography
Note that power point slides are on the class web site at http://www.geo.wvu.edu/~wilson/geol510.htm Instructor: Tom Wilson Office & Hours: rm 231 Brooks Hall, 10 to 11W, drop-ins welcome e-mail: tom.wilson@mail.wvu.edu ph: 293 6431 Time & Place: 3:30 – 4:45 MW (consider a change to 3 to 4:15 or other time?), rm 425 Brooks Hall (dual monitor lab) Grade: Attendance and class participation (10%), lab assignments/homework (55%) & term report (35% see syllabus for details). Attendance, class participation and getting assignments in on time is very important in this class since assignment content involves incremental skill development. If you miss class, then it’s easy to get behind. Also, assignments tend to be cumulative so if you don’t get one in on time then you may not have the necessary stepping blocks to do the next assignment. Note that if you take this class P/F, you are required to undertake all work – no exceptions. Prerequisites- BS in geology. Minimum pre-requisites geologist: structure and strat and sed; engineering: structural geology and petroleum geology. Tom Wilson, Department of Geology and Geography
First half of the semester … the focus on database development and integrated subsurface interpretations. Students build a data base that includes wells, logs and 3D seismic from scratch. Students undertake basic log interpretation, build cross section displays of their geophysical log correlations, and construct contour maps, isopach maps and curvature maps using state-of-art software tools. 3D seismic interpretation topics include some work with seismic attributes and fault patch extraction and analysis. Tom Wilson, Department of Geology and Geography
Second half In the second half of the semester, we cover special topics in seismic interpretation including basic concepts in spectral and wavelet analysis, calculation of vertical and lateral resolution limits and calibration curves, construction of synthetic seismograms and the use of spectral decomposition methods. Students gain operational familiarity with Petrel, Kingdom Suite, GeoTeric and Decision Space subsurface interpretation software. A final term project allows students to focus on individual interests/specialties. Term report guidelines are broadly defined and permit students to focus on thesis related or other topics of special interest. Tom Wilson, Department of Geology and Geography
Course Objectives • Integrate concepts and skills learned in structure, stratigraphy and sedimentation, petroleum geology, geophysics, and well log analysis into development of 3D reservoir models • Develop an understanding of some basic-to-advanced geophysical concepts • Along the way, you will gain familiarity with several software packages used in industry Tom Wilson, Department of Geology and Geography
Selected Learning Outcomes • Learn to develop well-to-well correlations of basic geophysical log responses & display in cross section view • Learn to construct a variety of maps displaying subsurface attributes such as horizon time and depth, interval thickness, faults, porosity and other reservoir parameters. • Learn how to develop 3D seismic interpretations • Develop an appreciation of issues associated with integration of subsurface well log derived interpretations into seismic interpretations. Are the two easily correlated? • Learn how resolution limits the seismic view • Learn about approaches to improve seismic resolution Tom Wilson, Department of Geology and Geography
Preliminaries Visit web site A continually updated resource General Questions? Tom Wilson, Department of Geology and Geography
A review of things you already know But a list deserving some review: basic procedures and protocols that help maximize outgrowths of team and individual project efforts. Useful ideas to carry forward into your thesis, internship and on-the-job efforts. 10 Key Aspects of Accurate Subsurface Interpretation and Mapping
1) All subsurface interpretations must be geologically and geometrically valid in three dimensions. 2) An interpreter must have a fundamental, classic education in geology and a strong background in structural geology for the tectonic setting being worked. (I’d go further and say that we need to understand other disciplines as well. The teams you work on in the future will be multidisciplinary) 3) Sufficient planning, time and detail are required to generate reliable prospects. Haste makes waste. The obvious … See this link to Tearpock’s list at http://dpa.aapg.org/correlator/doctrineQ111.cfm
4) All subsurface data must be used to develop a reasonable and accurate subsurface interpretation. 5) Accurate correlations (well log and seismic) are required for reliable geologic interpretations. 6) The use of correct mapping techniques and methods is essential to generate reasonable and correct subsurface interpretations. 10 Key Aspects-Cont’ See this link to Tearpock’s list at http://dpa.aapg.org/correlator/doctrineQ111.cfm
7) All important and relevant geologic surfaces must be mapped and the maps integrated to arrive at a reasonable and accurate subsurface picture. 8) The mapping of multiple horizons is essential to develop reasonably correct, three-dimensional interpretations of complexly faulted areas. 10 Key Aspects-Cont’ See this link to Tearpock’s list at http://dpa.aapg.org/correlator/doctrineQ111.cfm
9) Balanced cross sections are required to prepare a reasonably correct interpretation of complexly deformed structures. (I’d also suggest that scaling issues will significantly impact your ability to do this) 10) ALL WORK SHOULD BE DOCUMENTED! 10 Key Aspects-Cont’ See this link to Tearpock’s list at http://dpa.aapg.org/correlator/doctrineQ111.cfm
Computer mapping is not a black box (?) The paradigm that the computer makes unbiased maps should be taken with a grain of salt Changing the method changes the map An accurate and useful visualization of the area should be the most important goal. Basic perspectives Hannes E. Leetaru, Ills. Survey
1960-1980 Manager I will fire any geologist that bases a prospect on a computer drawn map 2007 New Petroleum Geologist What do you mean hand-contour, the computer does that. How times have changed NOW- The tide has turned again and we recognize that hand contouring is still a very valuable tool that helps guide your interpretation in a manor consistent with local structural and stratigraphic styles Hannes E. Leetaru, Ills. Survey
General workflow we will follow in the first few weeks of class to gain an appreciation of how subsurface interpretations are developed using integrated geological, geophysical, and engineering data in a computer workstation environment Plan and create the project database Interpretation Workflow Import Land & Lease Data Well Log Analysis Load Well Data Correlate marker horizons Geophysical Data Seismic Generate regional and local – area of interest - basemaps Interpretation Prospect Development Suggested workflow taken from GESExplorer course notes Tom Wilson, Department of Geology and Geography
Things to consider when building a data base • Project purpose • Project scope • Project coordinate systems • How do you identify wells in the database? (API#) • How do you identify formations? • (consistent abbreviations) • Well symbols • Handling digital vs raster well data • Dealing with different vendor data formats • Presentation formats Tom Wilson, Department of Geology and Geography
Using log data and interpretations to gain a basic insight into your prospect/play area Landgrid, culture, well spots, well logs, & seismic Maps. How good are they? How representative? How good are the picks? Would you drill a well based on this map? Interpreted cross section Tom Wilson, Department of Geology and Geography
Differences in structural interpretation Sullivan, 2013, Seismic Key in Marcellus Development: Eastern Oil and gas Conference Trade Show Tom Wilson, Department of Geology and Geography
Well log based interpretation vs seismic interpretation Sullivan, 2013, Seismic Key in Marcellus Development: Eastern Oil and gas Conference Trade Show Tom Wilson, Department of Geology and Geography
Landing the horizontal in areas of complex structure requires detailed knowledge of local structure Sullivan, 2013, Seismic Key in Marcellus Development: Eastern Oil and gas Conference Trade Show Tom Wilson, Department of Geology and Geography
General geological setting for the class data set The Frio Formation consists of Oligocene series strandplain deposits. These fluvial to near shore environments are highly heterogeneous. Some fields are said to have as many as 60 separate reservoirs. In the Stratton field the Frio consists of fluvial sands and the compartmentalization is within fluvial channels. Hardage et al. (1994) See http://www.ozestuaries.org/conceptual_mods/cm_coastal.htm Tom Wilson, Department of Geology and Geography
Complications: a sand is a sand is a sand … but is it the same sand body > reservoir heterogeneity > talk to the engineers! Bottom hole pressure variations (1992) Heterogeneity or compartmentalization can be estimated from well production history and reservoir pressure. Hardage et al. (1994) Tom Wilson, Department of Geology and Geography
Reservoir Heterogeneity Hardage et al. (1994) Tom Wilson, Department of Geology and Geography
One brings their perspective of the area into the interpretation Horizon and fault maping Tom Wilson, Department of Geology and Geography
We’ll spend the majority of the semester looking at prospect evaluation associated with the Stratton Detached Normal-Fault Block Assemblage Understanding structural styles is critical in the interpretation and prospect development phase. It is not within the scope of this class to provide a comprehensive view of structural styles. A good reference to review at this point would be Harding and Lowel’s paper on structural styles in seismic interpretation Understanding the structural style is often key to successful prospect development Tom Wilson, Department of Geology and Geography
structural style Structural context guides subsurface interpretation • Our view of the subsurface is usually based on very limited amounts of data and we have to fit our interpretations into certain cubby holes that are consistent with what we know about the structural and stratigraphic history of an area. Contour your well picks to match drag folds, normal, reverse or wrench fault settings, detached folds, basement upthrusts… to fit the structural style of the area you are working! Tom Wilson, Department of Geology and Geography
A quick look at some basic styles of deformation Fault Drag - Reverse Tom Wilson, Department of Geology and Geography
Traps developed in compressional tectonic regimes Friedman et al. (1976) Tom Wilson, Department of Geology and Geography
Fault traps are formed in a variety of tectonic settings Faults serve as a reservoir seal Reverse fault Normal fault http://www.priweb.org/ed/pgws/systems/traps/structural/structural.html http://www.geosci.usyd.edu.au/users/prey/ACSGT/EReports/eR.2003/GroupD/Report2/web%20pages/hydrocarbon_deposits.html Tom Wilson, Department of Geology and Geography
Fault Drag – Normal and Reverse http://academic.emporia.edu/aberjame/struc_geo/folds/fold2.htm Drag occurs along a fault surface, while the drape occurs over the underlying fault blocks Tom Wilson, Department of Geology and Geography
Fault bend and fault propagation folds http://homepage.ufp.pt/biblioteca/WebBasPrinTectonics/BasPrincTectonics/Page5.htm Tom Wilson, Department of Geology and Geography
What’s the structural history of this area? Where are the traps? Harding and Lowell, 1979 Tom Wilson, Department of Geology and Geography
Tilted fault block traps The mind set you carry into an interpretation is guided by the local structural style. Tom Wilson, Department of Geology and Geography
Wrench Fault Systems produce a variety of structures including en echelon alignments of structures oblique to the zone of deformation in which they occur. Riedel shear fractures The wrench fault system gives rise to a variety of compression, shear and extension produced structures Tom Wilson, Department of Geology and Geography
Where are the open mode fractures (i.e. joints)? Tom Wilson, Department of Geology and Geography
Complex structural interrelationships in wrench fault systems present confusing relationships in 2D view Harding and Lowell, 1979 Tom Wilson, Department of Geology and Geography
Wrench fault structural assemblage 1 Harding and Lowell, 1979 Tom Wilson, Department of Geology and Geography
Compressive fault block and basement upthrust Harding and Lowell, 1979 Tom Wilson, Department of Geology and Geography
Central Appalachians and Zagros – examples of detached fold and thrust belts McQuarrie, 2004 Tom Wilson, Department of Geology and Geography
Forced folds versus buckle folds Where is the neutral surface in these two cases? How do open model fracture distributions vary between these two styles of deformation? Tom Wilson, Department of Geology and Geography
Differential displacement within detached thrust sheets can produce cross-strike structural discontinuity and influence play concepts. Detached structure contouring would be modified to suggest possible influences of such zones on potential prospects. McQuarrie, 2004 Tom Wilson, Department of Geology and Geography
Compressive fault block and basement upthrust contour patterns Harding and Lowell, 1979 Tom Wilson, Department of Geology and Geography
Detached Normal Fault Assemblages Rollover anticline – down to basin fault Harding and Lowell, 1979 Tom Wilson, Department of Geology and Geography
Contour representations are non-unique -7100 -7100 -7100 -7300 Groshong, R., 2008, 3D Structural Geology Tom Wilson, Department of Geology and Geography
There are many valid, but considerably different ways to contour point data Groshong, R., 2008, 3D Structural Geology Tom Wilson, Department of Geology and Geography
Sampling problem Tom Wilson, Department of Geology and Geography
How we contour and envision reservoir location and compartmentalization depends on the style of deformation; our structural mindset Harding and Lowell, 1979 Tom Wilson, Department of Geology and Geography
Gulf of Mexico Tom Wilson, Department of Geology and Geography
Yucatan and Compeche block moving south of the North American plate Tom Wilson, Department of Geology and Geography
Area of active extension Tom Wilson, Department of Geology and Geography