Download
1 / 28
280 likes | 367 Views
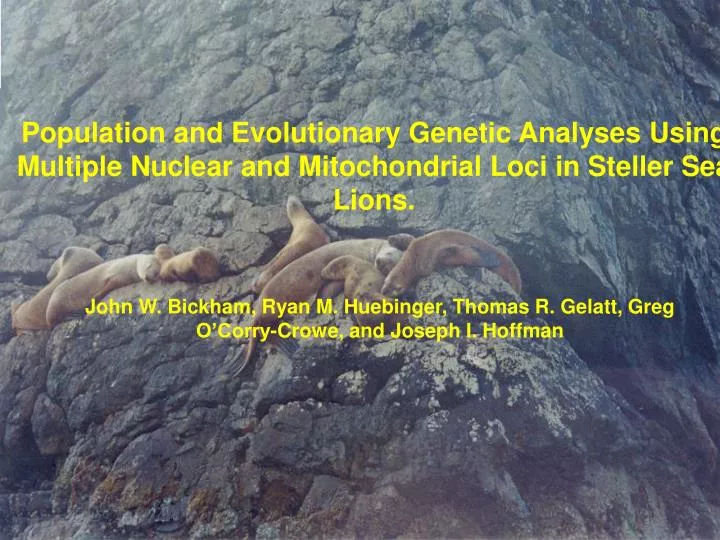
Population and Evolutionary Genetic Analyses Using Multiple Nuclear and Mitochondrial Loci in Steller Sea Lions. John W. Bickham, Ryan M. Huebinger, Thomas R. Gelatt, Greg O’Corry-Crowe, and Joseph I. Hoffman. ACKNOWLEDGEMENTS. Project began in 1992

E N D
Population and Evolutionary Genetic Analyses Using Multiple Nuclear and Mitochondrial Loci in Steller Sea Lions. John W. Bickham, Ryan M. Huebinger, Thomas R. Gelatt, Greg O’Corry-Crowe, and Joseph I. Hoffman
ACKNOWLEDGEMENTS • Project began in 1992 • I thank the following for providing samples: • T. Loughlin, T. Gelatt, V. Burkanov and D. Calkins • Southeastern Alaska and PWS-ADF&G • Gulf of Alaska and Aleutian Is.-NOAA sponsored cruises
ACKNOWLEDGEMENTS • Russia: Vladimir Burkanov, Nikolay Pavlov, Vladimir Vertynkin, Evgeny Mamaev. • The Alaska SeaLife Center, Don Calkins • For help in the laboratory and for data analysis I thank Alyson Baker, Robert Trujillo, John Patton, Cole Matson and Dmitri Politov.
200 180 160 140 120 100 80 60 40 20 0 Population Estimates for Steller Sea Lions (1960-1994) Eastern Stock East of 144°W Western Stock West of 144°W Population Estimates in Thousands 1960s 1970s 1980s 1990s 1994
Population Trends • The total SSL population numbered between 240,000 and 300,000 during the late 1950’s and early 1960’s. • Only 116,000 were estimated range-wide in 1989. -1969- -1979- -1989-
RUSSIA ALASKA PWS 60° BER OKH KAM CGA SEA COM WGA EAL WAL CAL BRC 45° KUR ORE Sampled Rookeries NCA JAPAN 30° 135°W 135°E 180°
Previous Genetic Studies • Bickham et al. (1996): • Discovered high genetic differentiation between populations on either side of 144˚W; subsequently recognized an eastern stock (threatened) and western stock (endangered) • Also found high diversity of “mtDNA haplotypes and a clear pattern of macrogeographic variation”
Cape Suckling 144°W Sampled Rookeries EASTERN STOCK WESTERN STOCK The Western and Eastern Stocks RUSSIA ALASKA PWS 60° BER OKH KAM CGA SEA COM WGA EAL WAL CAL BRC 45° KUR ORE NCA JAPAN 30° 135°W 135°E 180°
Previous Genetic Studies (cont) • Bickham et al. (1998) • Found evidence for three possible groups: Asian and central groups within the western stock and an eastern stock • Could have arisen due to two, possibly three, glacial refugia that separated the populations during the Pleistocene era
Sampled Rookeries EASTERN STOCK ASIAN STOCK WESTERN STOCK A Third Stock? • Previous research suggests that animals sampled from Russian rookeries are genetically distinct from other western stock sea lions. RUSSIA ALASKA PWS Cape Suckling 60° BER OKH KAM CGA SEA COM WGA EAL WAL CAL BRC 45° KUR ORE 144°W NCA JAPAN 30° 135°W 135°E 180°
Previous Genetic Studies (cont) • Baker et al. (2005) • Subdivided the Western Stock into Asian Stock (OKH, KUR, KAM) and Western Stock (COM east through PWS)
In this presentation we will: • Summarize a 14-year range-wide population-genetic analysis based upon the mtDNA control region of Steller sea lions. • Present preliminary results from an ongoing complementary study of cytochrome b sequences. • Compare phylogeographic and population genetic patterns for control region vs. cyt b sequences. • Present data from nuclear microsatellite loci that corroborate some of the findings of stock structure in Steller sea lions.
L-shaped distribution of control-region haplotypes No evidence of a significant bottleneck or reduction in variation
KUR EAL BRC NCA CAL BER KUR EAL BRC NCA SEA CAL BER OKH COM CGA ORE SEA OKH COM CGA ORE KAM WAL PWS KAM WAL PWS WGA WGA Control Region Haplotype Distributions Haplotype LLL Haplotype BB 0.50 0.10 0.40 0.08 0.30 0.06 Haplotype Frequency Haplotype Frequency 0.20 0.04 0.10 0.02 0.00 0.00 KUR EAL BRC NCA KUR EAL BRC NCA CAL BER CAL BER SEA SEA OKH COM CGA ORE OKH COM CGA ORE KAM WAL KAM WAL PWS PWS WGA WGA Haplotype E Haplotype H 0.12 0.50 0.10 0.40 0.08 0.30 Haplotype Frequency Haplotype Frequency 0.06 0.20 0.04 0.10 0.02 0.00 0.00
NCA NCA NCA NCA KUR KUR KUR KUR EAL EAL EAL EAL BRC BRC BRC BRC CAL CAL CAL CAL BER BER BER BER SEA SEA SEA SEA OKH OKH OKH OKH COM COM COM COM CGA CGA CGA CGA ORE ORE ORE ORE KAM KAM KAM KAM WAL WAL WAL WAL PWS PWS PWS PWS WGA WGA WGA WGA Cytochrome b Haplotype Distributions Haplotype 1 Haplotype 4 1.00 1.00 0.90 0.90 0.80 0.80 0.70 0.70 0.60 0.60 0.50 0.50 Haplotype Frequency Haplotype Frequency 0.40 0.40 0.30 0.30 0.20 0.20 0.10 0.10 0.00 0.00 Haplotype 2 Haplotype 10 1.00 1.00 0.90 0.90 0.80 0.80 0.70 0.70 0.60 0.60 0.50 0.50 Haplotype Frequency Haplotype Frequency 0.40 0.40 0.30 0.30 0.20 0.20 0.10 0.10 0.00 0.00
NJ Tree for Rookeries Based on Fst Estimates Control Region Adak Island CAL Akun Island EAL Seal Rocks PWS Clubbing Rocks WGA Yunaska Island CAL Ugamak Island EAL Chirikof Island CGA Amak Island EAL Bogoslof Island EAL Pinnacle Rock WGA Chowiet Island CGA Marmot Island CGA Adugak Island EAL Attu Island WAL Amchitka Island CAL Seguam Island CAL Medney Island COM Kasatoshi Island CAL Sugarloaf Island CGA Akutan Island EAL Agattu Island WAL Kozlova Cape RUS Walrus Island BER Fish Island PWS Kiska Island Lief Cove CAL Kiska Island Cape St. Stephen CAL Buldir Island WAL Gramp Rock CAL Atkins Island WGA Legend Asian Stock Western Stock Eastern Stock Tag Island CAL Ogchul Island EAL Antsiferova Island KUR Zheleznaya Bay KAM Raykoke Island KUR Iony Island OKH Tuleniy Island OKH Srednego Island KUR Yamsky Island OKH Lovushki Island KUR Chernyye Bratya KUR Forrester Island SEA North Danger Rocks BRC St. George Reef NCA Triangle Island BRC Hazy Islands SEA Rogue Reef ORE White Sisters Islands SEA 0.005 changes
NJ Tree Regions Based on Fst Estimates Control Region OKH KUR KAM COM CAL EAL CGA WGA PWS BER WAL Legend Eastern Stock Western Stock Asian Stock SEA BRC ORE NCA 0.005 changes
NJ Zalophus A XXXX UUUUU IIII NNN EEEEE TTTTT E ZZZ NJ tree of control region haplotypes shows two distinct eastern stock haplotype lineages. F XX VV AAAAA FFFF B R FFFFF RRRR UU XXXXX P SSSS III Q C YYYYY D H GGGG SS BBBBB I YY J IIIII LL GGGGG L CCCCC M ZZ BBBBBB CCC N VVVV DDDDD K O WWWW UUUU OO WW Z QQ JJJ FFF DDD QQQQQ AA PP KKK YYY RRRRR BB GGG YYYY LLL TTT BBBB MMM JJJJ RRR SSS VVVVV AAAA HHHH RR S MMMMM OOOOO Y KKKKK NNNNN QQQ OOOO LLLLL KKKK PPPPP LLLL V W BBB PPP X HH MMMM TTTT II GG TT JJ MM PPPP KK OOO VVV CC HHHHH DD HHH NNNN AAAAAA JJJJJ T NN U EE UUU ZZZZ AAA EEE FF CCCC WWWWW ZZZZZ QQQQ G XXX WWW EEEE DDDD SSSSS 0.001 substitutions/site
WEST EAST ASIAN ALL Minimum Spanning Network of Steller Sea Lion Cytochrome b haplotypes n = 878, 1040 bp 29 Variable Positions Ti/Tv = 26/3 13 Silent, 13 Nonsynonymous Transitions 1 Silent, 2 Nonsynonymous Transversions 1st Position: 10 (9 AAS) 2nd Position: 6 (6 AAS) 3rd Position: 13 (0 AAS) 14 Total Variable Amino Acids 29 5 16 34 33 28 1 18 20 22 ? 25 24 7 19 9 17 23 21 8 3 27 11 12 200+ 4 14 13 32 15 25-50 100-200 26 2 10-25 31 50-100 2-10 10 6 White Line: Silent Mutation Red Line: Amino Acid Shift 30 ? 1
Regional Cytochrome b Slatkin’s Linearized FST Midpoint Rooted NJ Phylogram OKH KUR KAM COM CAL CGA WAL WGA BER EAL PWS Legend Eastern Stock Western Stock Asian Stock BRC ORE SEA NCA 0.05 changes
Asian Stock - Yamsky Island OKH - Srednego Island KUR - Raykoke Island KUR - Kozlova Cape KAM - Iony Island OKH - Lovushki Island KUR - Kiska Island CAL - Seguam Island CAL - Sugarloaf Island CGA - Yunaska Island CAL - Akutan Island EAL - Chirikof Island CGA - Ogchul Island EAL - Ugamak Island EAL - Pinnacle Rocks WGA - Medny Island COM - Adugak Island EAL - Antsiferova Island KUR - Clubbing Rocks WGA - Walrus Island BER - Seal Rocks PWS - Buldir Island WAL - Chowiet Island CGA - Fish Island PWS - Atkins Island WGA - Rogue Reef ORE - St. George Island NCA - North Danger Rocks BRC Eastern - Triangle Island BRC Stock - Forrester Island SEA - White Sisters Island SEA - Hazy Island SEA 0.01 NJ Phylogram of Rookeries Based on Microsatellite Data Asian Stock Western Stock Legend Eastern Stock Western Stock Asian Stock
NJ Phylogram of Regions Based on Microsatellite Data. OKH Asian KAM Stock KUR WAL CAL COM EAL Western Stock BER WGA CGA PWS ORE NCA Eastern Stock BRC SEA 0.01 Legend Eastern Stock Western Stock Asian Stock
Conclusions Control Region Phylogeography • Despite the generally high sample sizes in this study, resolution of population substructure increased when rookeries were grouped into their respective regions. Control region sequences clearly support the recognition of three stocks. • Cytochrome b Phylogeography • Clearly differentiates the eastern and western stocks but does not resolve the Asian stock. • Microsatellite Analysis • Nuclear microsatellites show a pattern nearly the same as for the cytochrome b gene. • Clearly differentiates the eastern and western stocks but does not resolve the Asian stock.
Sampled Rookeries EASTERN STOCK ASIAN STOCK WESTERN STOCK The Asian Stock • The recognition of three management units may be appropriate for Steller sea lion conservation. RUSSIA ALASKA PWS Cape Suckling 60° BER OKH KAM CGA SEA COM WGA EAL WAL CAL BRC 45° KUR ORE 144°W NCA JAPAN 30° 135°W 135°E 180°