Download
1 / 9
90 likes | 209 Views
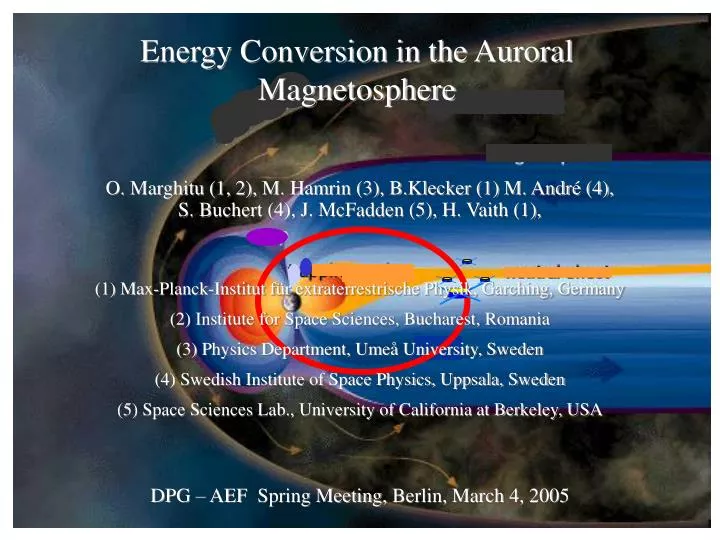
Energy Conversion in the Auroral Magnetosphere. O. Marghitu (1, 2), M. Hamrin (3), B.Klecker (1) M. André (4), S. Buchert (4), J. McFadden (5), H. Vaith (1), (1) Max-Planck-Institut f ür extraterrestrische Physik, Garching, Germany (2) Institute for Space Sciences, Bucharest, Romania

E N D
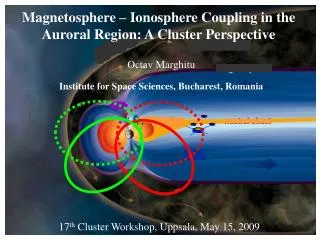
Energy Conversion in the Auroral Magnetosphere O. Marghitu (1, 2), M. Hamrin (3), B.Klecker (1) M. André (4), S. Buchert (4), J. McFadden (5), H. Vaith (1), (1) Max-Planck-Institut für extraterrestrische Physik, Garching, Germany (2) Institute for Space Sciences, Bucharest, Romania (3) Physics Department, Umeå University, Sweden (4) Swedish Institute of Space Physics, Uppsala, Sweden (5) Space Sciences Lab., University of California at Berkeley, USA DPG – AEF Spring Meeting, Berlin, March4, 2005
Outline • Motivation • Event on September 20, 2001: Conjunction geometry • Event study: Data, E•J signature • Summary and prospects
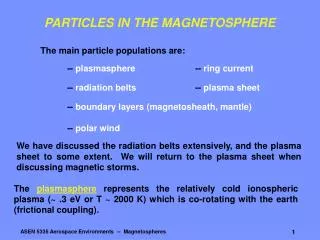
A Motivation A • There is a significant number of theoretical studies on the auroral generator region: • Analytical => e.g. Rostoker and Boström, 1976 • Semi-analytical => e.g. Lysak, 1985, Vogt et al., 1999 • Numerical simulations => e.g. Birn et al, 1996, Birn and Hesse, 1996 • However, to our knowledge, the experimental investigations of the generator region are missing, as far as the evaluation of E•J is concerned: • The one s/c missions before Cluster could not fully resolve J • Both J and (mainly) E are close to the instrumental detection limit
A Motivation A The energy flux of a strong aurora, ~10-2 W/m2, maps to ~10-5 W/m2 in the tail (mapping factor ~1000). If the generator region extends 107 – 108 m along the magnetic field line, the power density is ~10-13 – 10-12 W/m3.
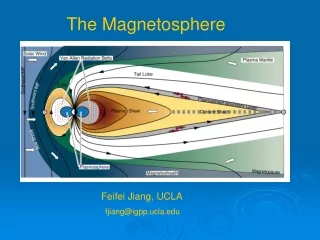
B Conjunction Geometry B Cluster in the tail, at ~20RE; FAST above the auroral oval, at ~0.5RE
B Conjunction Geometry B No ground optical data. No optical data from IMAGE or Polar.
C Event Study: Data C 1 mW/m2 16 mW/m2
C Event Study: E•J C E•J 5 •10 -13 The signature E•J < 0 not seen in EFW, because it comes mainly form Cluster 1, where ASPOC is off.
Extension of the time interval to 5h => includes two additional conjunctions with FAST • Potential for a statistical investigation of several events in September – October 2001. • Potential for application to other generator regions (LLBL, ...) D Summary and Prospects D • First experimental evidence for the crossing of an auroral generator region. • The signature in E•J consistent with the order of magnitude estimate.