Download
1 / 21
210 likes | 320 Views
Introduction to Basic Statistical Methods Part 1: Statistics in a Nutshell UWHC Scholarly Forum May 21, 2014 Ismor Fischer, Ph.D. UW Dept of Statistics ifischer@wisc.edu. Part 2: Overview of Biostatistics: “ Which Test Do I Use??”.

E N D
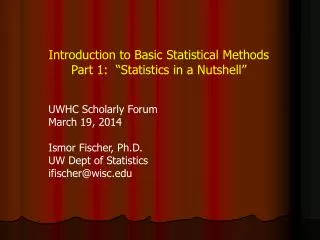
Introduction to Basic Statistical Methods Part 1: Statistics in a Nutshell UWHC Scholarly Forum May 21, 2014 Ismor Fischer, Ph.D. UW Dept of Statistics ifischer@wisc.edu Part 2: Overview of Biostatistics: “Which Test Do I Use??” All slides posted at http://www.stat.wisc.edu/~ifischer/Intro_Stat/UWHC
Right-cick on image for full .pdf article • Links in article to access datasets
“Statistical Inference” POPULATION Study Question: Has mean (i.e., average) of X = “Age at First Birth” of women in the U.S. changed since 2010 (25.4yrs old)? Present Day: AssumeX = “Age at First Birth” follows a normal distribution (i.e., “bell curve”) in the population. Population Distribution X
“Statistical Inference” POPULATION Study Question: Has mean (i.e., average) of X = “Age at First Birth” of women in the U.S. changed since 2010 (25.4yrs old)? Present Day: AssumeX = “Age at First Birth” follows a normal distribution (i.e., “bell curve”) in the population. Population Distribution X
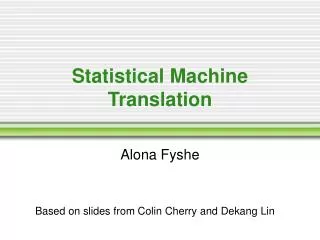
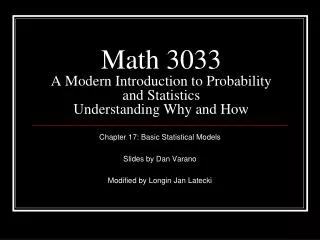
~ The Normal Distribution ~ “population standard deviation” “population mean” • symmetric about its mean • unimodal (i.e., one peak), • with left and right “tails” • models many (but not all) • naturally-occurring systems • useful mathematical • properties…
~ The Normal Distribution ~ “population standard deviation” = ? 95% 2.5% 2.5% ≈ 2 σ ≈ 2 σ = ? “population mean” • symmetric about its mean Approximately 95% of the population values are contained between – 2σ and + 2σ. • unimodal (i.e., one peak), • with left and right “tails” • models many (but not all) • naturally-occurring systems 95% is called the confidence level. 5% is called the significance level. • useful mathematical • properties…
“Statistical Inference” POPULATION via… “Hypothesis Testing” Study Question: Has “Mean (i.e., average) Age at First Birth” of women in the U.S. changed since 2010 (25.4 yrs old)? Present Day: Assume “Mean Age at First Birth” follows a normal distribution (i.e., “bell curve”)in the population. Population Distribution = ? X H0: pop mean age = 25.4 (i.e., no change since 2010) Random Sample size n = 400 ages “Null Hypothesis” x4 x1 x3 cannot be found with 100% certainty, but can be estimated with high confidence (e.g., 95%) from sample data. x2 x5 … etc… ? x400 Sample size n partially depends on the power of the test, i.e., the desired probability of correctly rejecting a false null hypothesis ( 80%).
“Statistical Inference” POPULATION via… “Hypothesis Testing” Study Question: Has “Mean (i.e., average) Age at First Birth” of women in the U.S. changed since 2010 (25.4 yrs old)? Present Day: Assume “Mean Age at First Birth” follows a normal distribution (i.e., “bell curve”)in the population. Population Distribution = ? X H0: pop mean age = 25.4 (i.e., no change since 2010) Random Sample size n = 400 ages “Null Hypothesis” x4 x1 sample mean age x3 x2 x5 … etc… sample variance x400
“Statistical Inference” POPULATION via… “Hypothesis Testing” Study Question: Has “Mean (i.e., average) Age at First Birth” of women in the U.S. changed since 2010 (25.4 yrs old)? Present Day: Assume “Mean Age at First Birth” follows a normal distribution (i.e., “bell curve”)in the population. Population Distribution = ? s = 1.6 X H0: pop mean age = 25.4 (i.e., no change since 2010) Random Sample size n = 400 ages “Null Hypothesis” x4 x1 sample mean age x3 x2 x5 … etc… sample standard deviation sample variance x400
“Statistical Inference” POPULATION via… “Hypothesis Testing” Study Question: Has “Mean (i.e., average) Age at First Birth” of women in the U.S. changed since 2010 (25.4 yrs old)? Present Day: Assume “Mean Age at First Birth” follows a normal distribution (i.e., “bell curve”)in the population. The population distribution of X follows a bell curve, with standard deviation . Population Distribution s = 1.6 X H0: pop mean age = 25.4 (i.e., no change since 2010) Random Sample size n = 400 ages “Null Hypothesis” x4 x1 sample mean age x3 x2 x5 … etc… x400 Do the data tend to support or refute the null hypothesis? Is the difference STATISTICALLY SIGNIFICANT, at the 5% level?
“Statistical Inference” POPULATION via… “Hypothesis Testing” Study Question: Has “Mean (i.e., average) Age at First Birth” of women in the U.S. changed since 2010 (25.4 yrs old)? Present Day: Assume “Mean Age at First Birth” follows a normal distribution (i.e., “bell curve”)in the population. The “sampling distribution” of also follows a bell curve, with standard deviation / Population Distribution s = 1.6 X H0: pop mean age = 25.4 (i.e., no change since 2010) Random Sample size n = 400 ages “Null Hypothesis” x4 x1 sample mean age x3 x2 x5 … etc… x400 Do the data tend to support or refute the null hypothesis? Is the difference STATISTICALLY SIGNIFICANT, at the 5% level?
“Statistical Inference” POPULATION via… “Hypothesis Testing” Study Question: Has “Mean (i.e., average) Age at First Birth” of women in the U.S. changed since 2010 (25.4 yrs old)? Present Day: Assume “Mean Age at First Birth” follows a normal distribution (i.e., “bell curve”)in the population. But estimating by s introduces an additional layer of “sampling variability.” Population Distribution s = 1.6 X H0: pop mean age = 25.4 (i.e., no change since 2010) Random Sample size n = 400 ages “Null Hypothesis” x4 x1 sample mean age x3 x2 x5 … etc… x400 Do the data tend to support or refute the null hypothesis? Is the difference STATISTICALLY SIGNIFICANT, at the 5% level?
“Statistical Inference” POPULATION via… “Hypothesis Testing” Study Question: Has “Mean (i.e., average) Age at First Birth” of women in the U.S. changed since 2010 (25.4 yrs old)? Present Day: Assume “Mean Age at First Birth” follows a normal distribution (i.e., “bell curve”)in the population. In order to take this into account, a cousin to the normal distribution called the “T-distribution” is used instead (Gossett, 1908). Population Distribution s = 1.6 X H0: pop mean age = 25.4 (i.e., no change since 2010) Random Sample size n = 400 ages “Null Hypothesis” x4 x1 sample mean age x3 x2 x5 … etc… x400 Do the data tend to support or refute the null hypothesis? Is the difference STATISTICALLY SIGNIFICANT, at the 5% level?
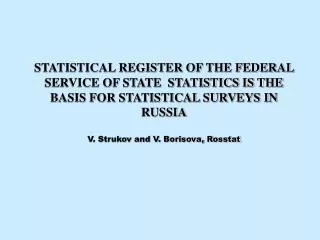
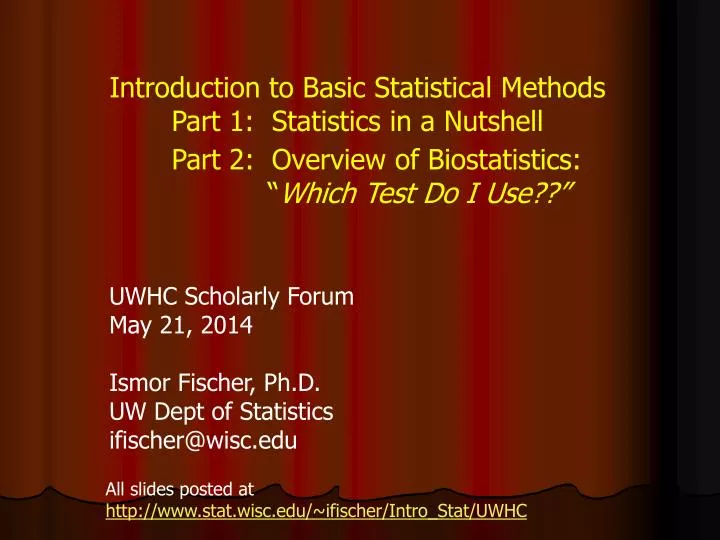
Student’s T-Distribution … is actually a family of distributions, indexed by the degrees of freedom df = n – 1, labeled tdf. “standard” bell curve: = 0, = 1 tdf William S. Gossett (1876 - 1937) t1 As n gets large, tdf converges to the standard normal distribution. But the heavier tails mean a wider interval is needed to capture 95%, especially if n is small.
“Statistical Inference” POPULATION via… “Hypothesis Testing” Study Question: Has “Mean (i.e., average) Age at First Birth” of women in the U.S. changed since 2010 (25.4 yrs old)? Present Day: Assume “Mean Age at First Birth” follows a normal distribution (i.e., “bell curve”)in the population. In order to take this into account, a cousin to the normal distribution called the “T-distribution” is used instead (Gossett, 1908). Population Distribution s = 1.6 T-test X H0: pop mean age = 25.4 (i.e., no change since 2010) Random Sample size n = 400 ages “Null Hypothesis” x4 x1 sample mean age x3 x2 x5 … etc… x400 Do the data tend to support or refute the null hypothesis? Is the difference STATISTICALLY SIGNIFICANT, at the 5% level?
“Statistical Inference” POPULATION via… “Hypothesis Testing” Study Question: Has “Mean (i.e., average) Age at First Birth” of women in the U.S. changed since 2010 (25.4 yrs old)? Present Day: Assume “Mean Age at First Birth” follows a normal distribution (i.e., “bell curve”)in the population. Population Distribution s = 1.6 T-test X H0: pop mean age = 25.4 (i.e., no change since 2010) Random Sample size n = 400 ages “Null Hypothesis” x4 x1 sample mean age x3 x2 x5 … etc… x400 Do the data tend to support or refute the null hypothesis? Is the difference STATISTICALLY SIGNIFICANT, at the 5% level?
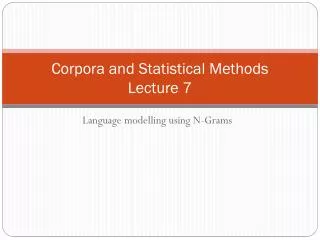
Two main ways to conduct a formal hypothesis test: 95% CONFIDENCE INTERVAL FOR µ 25.44 25.76 BASED ON OUR SAMPLE DATA, the true value of μ today is between 25.44 and 25.76 years, with 95% “confidence” (…akin to “probability”). “P-VALUE” of our sample IF H0 is true, then we would expect a random sample mean that is at least 0.2 years away from = 25.4 (as ours was), to occur with probability 1.28%. Very informally, the p-value of a sample is the probability (hence a number between 0 and 1) that it “agrees” with the null hypothesis. Hence a very small p-value indicates strong evidence against the null hypothesis. The smaller the p-value, the stronger the evidence, and the more “statistically significant” the finding (e.g., p < .0001).
Two main ways to conduct a formal hypothesis test: • FORMAL CONCLUSIONS: • The 95% confidence interval corresponding to our sample mean does not contain the “null value” of the population mean, μ = 25.4 years. • The p-value of our sample, .0128, is less than the predetermined α = .05 significance level. • Based on our sample data, we may (moderately) reject the null hypothesis H0: μ = 25.4 in favor of the two-sided alternative hypothesis HA: μ ≠ 25.4, at the α = .05 significance level. • INTERPRETATION: According to the results of this study, there exists a statistically significantdifference between the mean ages at first birth in 2010 (25.4 years old) and today, at the 5% significance level. Moreover, the evidence from the sample data would suggest that the population mean age today is significantly older than in 2010, rather than significantly younger. 95% CONFIDENCE INTERVAL FOR µ 25.44 25.76 BASED ON OUR SAMPLE DATA, the true value of μ today is between 25.44 and 25.76 years, with 95% “confidence” (…akin to “probability”). IF H0 is true, then we would expect a random sample mean that is at least 0.2 years away from = 25.4 (as ours was), to occur with probability 1.28%. “P-VALUE” of our sample Very informally, the p-value of a sample is the probability (hence a number between 0 and 1) that it “agrees” with the null hypothesis. Hence a very small p-value indicates strong evidence against the null hypothesis. The smaller the p-value, the stronger the evidence, and the more “statistically significant” the finding (e.g., p < .0001).
Edited R code: y = rnorm(400, 0, 1)z = (y - mean(y)) / sd(y)x = 25.6 + 1.6*z sort(round(x, 1)) Generates a normally-distributed random sample of 400 age values. [1] 19.6 20.2 20.4 20.5 21.2 22.3 22.3 22.4 22.4 22.4 22.6 22.7 22.7 22.7 22.8 [16] 23.0 23.0 23.1 23.1 23.2 23.2 23.2 23.2 23.2 23.3 23.4 23.4 23.4 23.5 23.5 etc... [391] 28.7 28.7 28.9 29.2 29.3 29.4 29.6 29.7 29.9 30.2 Calculates sample mean and standard deviation. c(mean(x), sd(x)) [1] 25.61.6 t.test(x, mu = 25.4) One Sample t-test data: x t = 2.5, df = 399, p-value = 0.01282 alternative hypothesis: true mean is not equal to 25.4 95 percent confidence interval: 25.44273 25.75727 sample estimates: mean of x 25.6
“Statistical Inference” POPULATION via… “Hypothesis Testing” Study Question: Has “Mean (i.e., average) Age at First Birth” of women in the U.S. changed since 2010 (25.4 yrs old)? Assume Present Day: Assume “Mean Age at First Birth” follows a normal distribution (i.e., “bell curve”)in the population. Population Distribution = ? X H0: pop mean age = 25.4 (i.e., no change since 2010) Random Sample size n = 400 ages The reasonableness of the normality assumption is empirically verifiable, and in fact formally testable from the sample data. If violated (e.g., skewed) or inconclusive (e.g., small sample size), then “distribution-free” nonparametric tests should be used instead of the T-test… Examples: Sign Test, Wilcoxon Signed Rank Test (= Mann-Whitney U Test) x4 x1 x3 x2 x5 … etc… x400