Download
1 / 37
380 likes | 547 Views
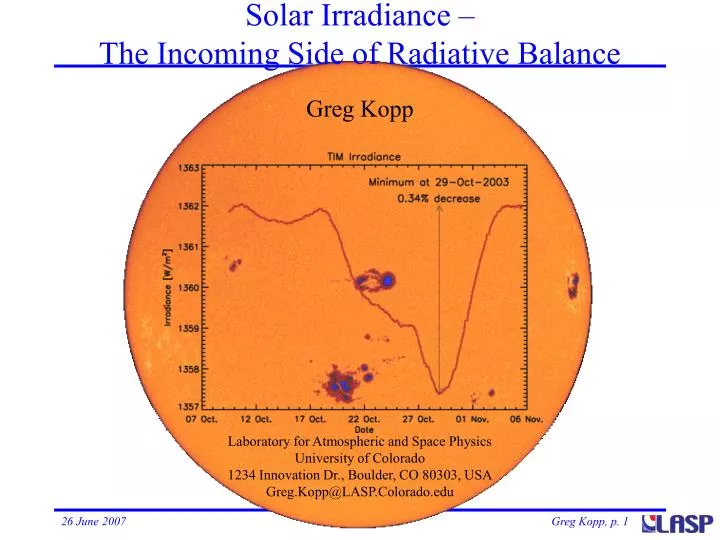
Solar Irradiance – The Incoming Side of Radiative Balance. Greg Kopp. Laboratory for Atmospheric and Space Physics University of Colorado 1234 Innovation Dr., Boulder, CO 80303, USA Greg.Kopp@LASP.Colorado.edu. 4.0 Incoming Solar Radiation at TOA. Chapter lead: Raschke with Kopp

E N D
Solar Irradiance –The Incoming Side of Radiative Balance Greg Kopp Laboratory for Atmospheric and Space Physics University of Colorado 1234 Innovation Dr., Boulder, CO 80303, USA Greg.Kopp@LASP.Colorado.edu
4.0 Incoming Solar Radiation at TOA Chapter lead: Raschke with Kopp • 4.1 Uncertainties of Solar Constant Measurements • 4.2 Global/Seasonal Distribution • 4.3 Representation in Satellite Products • 4.4 Survey of Models
4.0 Incoming Solar Radiation at TOA Chapter lead: Raschke with Kopp • 4.1 Uncertainties of Solar Irradiance Measurements • It’s not constant • 4.2 Global/Seasonal Distribution • Global - Divide direct solar-pointed irradiance measurements by 4 • Seasonal - 6.6% variation; geometric; & sensitive to 11-year solar cycle • 4.3 Representation in Satellite Products • Total solar irradiances - continuous from 1978 onward • Solar spectral irradiances across spectrum from 2003 onward • 4.4 Survey of Models (Solar) • Address solar activity pretty well on short time scales • Do not address potential long-term fluctuations
Solar Irradiance Is Linked With Solar Activity The “solar constant” isn’t.
Solar and Anthropogenic Climate Signals from Judith Lean, NRL GISS Land+Ocean Global Temperature monthly means El Nino La Nina volcanic aerosols omitting solar forcing .. poorer tracking of centennial variations .. higher sensitivity to GHGs http://data.giss.nasa.gov/ greenhouse gases industrial aerosols
None of these instruments is calibrated end-to-end for irradiance. TSI Climate Record ~30 Years Young Data are readily available! (And have very few parameters)
Future Needs: TSI – Accuracy and Stability • Performance Requirements • Accuracy 0.01% (1 ) • Stability 0.001%/yr (1 ) • Noise 0.001% (1 )
Total Irradiance Monitor (TIM) Major Advances • Nickel-Phosphorous (NiP) black absorber provides high absorptivity and radiation stability • Phase sensitive detection at the shutter fundamental frequency reduces noise • Optical design reduces effects of scattered light and diffraction
Summary of Stated Instrument Accuracies Uncertainties are 1-
TSI Instrument Uncertainties & Intra-Instrument Variations Uncertainties are 1-
Diffraction Can Erroneously Change Signal • All instruments except TIM put primary aperture close to the cavity Sunlight Sunlight View-Limiting Aperture Precision Aperture Precision Aperture View-Limiting Aperture NIST calculates this to be a 0.13% effect in the ACRIM instruments, and it is not corrected Failure to correct for light diffracted into cavity erroneously increases signal Failure to correct for light diffracted out of cavity erroneously decreases signal
Scatter Can Erroneously Increase Signal • All instruments except TIM put primary aperture close to the cavity Sunlight Sunlight View-Limiting Aperture Precision Aperture Precision Aperture View-Limiting Aperture Additional light allowed into instrument can scatter into cavity Majority of light is blocked before entering instrument
NIST calculates diffraction should lower these results. TSI Instrument Uncertainties & Intra-Instrument Variations
TSI Instrument Uncertainties – With Diffraction Correction Correction not yet approved or applied by ACRIM or ERBE Teams
Address Applied Power: Trap Diode Power Comparison • This was a recommendation from the 2005 TSI Accuracy Workshop • NIST and LASP performed optical power comparisons between a trap diode transfer standard and a ground-based TIM • Applying solar power levels with the TIM in vacuum • NPL has done similar power comparisons before, but in air Brewster vacuum window TSI instrument shutter stabilized laser 70 mW beamsplitter (0.2%) <1 mW trap diode This is an optical power measurement, not irradiance
NIST Power Comparison Setup • Coherent Verdi V10 532-nm laser • CRI laser stabilizer • Spatial filter (pinhole) • Beam monitor to control stabilizer • Uniblitz shutter to modulate laser beam • Dual beam splitters (500:1) give parallel beam to trap diode • TIM gets primary beam • in vacuum behind Brewster window • on translation stage • Trap diode monitors low-power beam • on same translation stage as TIM • has 8 mm aperture Thanks to Allan Smith and Joe Rice!
Measure Power Level for All Four TIM Cones • The TIM Witness Unit measures laser power lower than NIST by 0.12% • This is an end-to-end optical power measurement • Cone-to-cone variability spread is 230 ppm • Measurements are consistent • Need to verify some factors • Non-equivalence for DC subtraction method, heater resistances, gain
No flight TSI instrument has been calibrated end-to-end First facility to measure irradiance at desired accuracies at solar power levels in vacuum TSI Radiometer Facility Measures Irradiance
NIST calculations for ACRIM aperture diffraction indicate all three ACRIMinstrumentsshould have lower TSI values by 1.8 W/m2 • ERBE should also be lowered • NIST aperture area calibrations may indicate even larger differences Radiative Flux: SORCE TIM Indicates Lower TSI Value Fundamental discovery that the TSI is ~1361 W/m2, not 1366 W/m2 (TIM). SORCE/TIM result motivated detailed examination by NIST and TSI community. • TIMTSIis 4.7 W/m2 lower than other recent measurements • NIST radiometric power comparisons with ground-based TIM do not indicate an error with the TIMTSI value
Solar Total Irradiance Measurement Summary • Continuous and overlapping measurements are critical in maintaining a long term data record. • Critical for climate • Useful for inputs to solar and atmospheric models • NIMBUS7 ERB (1978 - 1993) • SMM ACRIM I (1980 - 1989) • ERBS ERBE (1984 - 2003) • UARS ACRIM II (1991 - 2001) • SOHO VIRGO (1996 - ) • ACRIMSat ACRIM III (1999 - ) • SORCE TIM (2003 - ) • PICARD PMO6 & SOVAP (2008 - ) • Glory TIM (2008 - ) • NPOESS TIM (2013 - ) ? ?
Solar Variability Depends on Wavelength SORCE and TIMED provide the first ever daily measurements of solar spectrum variations throughout the X-ray, UV, visible, and NIR
Solar Cycle Variationfor the downward trend, 1991 to 1997. The uncertainty in these ratios are larger since they invoke knowledge of the instrument sensitivity over a time period of 5 years. Solar Variability on Different Time Scales 27-Day Variationfor a single solar rotation period. Other time periods show more or less variation, but with the same general spectral shape. Data from UARS/SOLSTICE
Also Need Solar Spectral Irradiance Inputs Near UV, visible, near infrared radiation affect surface and ocean processes Chemistry Climate Models Need SSI GISS GCM [Rind et al., 2004; Shindell et al., 2006] NCAR WACCM [Marsh et al., 2007] HAMMONIA [Schmidt and Brasseur, 2006] CMAM [Beagley et al., 1997] [Adapted from P. Pilewskie, Solar Physics, 2005]
Total Irradiance Monitor (TIM) TIM SIM Spectral Irradiance Monitor (SIM) 200 – 2000 nm TIMED EGS SOLSTICE SOLar STellar Irradiance Comparison Experiment (SOLSTICE) 120 – 300 nm XUV Photometer System (XPS) 1 – 34 nm XPS XUV EUV UV IR SORCE and TIMED Measure Irradiance Across Spectrum • Solar irradiance measurements since March 2003 • Nearly complete solar spectral coverage
Solar Spectral Irradiance Measurement Summary • GOES XRS (1975 - ) • POES SBUV (1985 - ) • SME (1981 - 1990) • UARS (1991 - 2005) • GOME (1995 - ) • SOHO SEM (1996 - ) • SOHO VIRGO SPM (1996 - ) • SNOE (1998 - 2003) • TIMED (2001 - 2008) • SORCE (2003 - 2009) • GOES EUVS (2006 - ) • SDO EVE (2008 - 2013+) • NPOESS SIM (2013 - ) ?
Solar Spectral Irradiance Time Series Increasing Wavelength • GOES X-Ray Sensor (XRS) - since 1975 • 2 channels: 0.05 to 0.4 nm and 0.1 to 0.8 nm at 0.512-s cadence • TIMED and SORCE XUV Photometer System (XPS) - since 2001 • 8 filter bandpasses from 0.1 to 34 nm and Ly- • SOHO Solar Extreme Ultraviolet Monitor (SEM) - since 1996 • 2 filter and transmission grating bandpasses 0.1 to 50 nm & 30.4 nm (He II) • SNOE Solar X-ray Photometer (SXP) - 1998 to 2003 • 5 filter bandpasses from 2 to 35 nm • TIMED EUV Grating Spectrograph (EGS) - since 2001 • 25 to 200 nm with 0.4 nm resolution • Solar Mesospheric Explorer (SME) - 1981 to 1990 • 115 to 302 nm • UARS and SORCE SOLSTICE - since 1991 • 115 to 320 nm with 0.1-0.2 nm resolution, 0.5% precision, daily spectra • UARS Solar Ultraviolet Spectral Irradiance Monitor (SUSIM) - 1991 to 2005 • 115 to 410 nm w/ 1 nm resolution, daily cadence, 2% precision • POES SBUV/2 - since 1985 • 160 to 400 nm with 1.1 nm resolution, daily cadence includes Mg II core to wing • ERS2 Global Ozone Monitoring Experiment (GOME) - since 1995 • 240-400 nm, Mg II core to wing • SOHO VIRGO SPM - since 1996 • 3 filter bandpasses (402, 500, 862 nm) with 5 nm resolution, 1-min cadence • ENVISAT SCanning Imaging Absorption spectroMeter for Atmospheric CHartographY (SCIAMACHY) - since 2002 • 240 to 2380 nm with 0.2 to 1.5 nm resolution • SORCE SIM - since 2003 • 200 to 2700 nm with 0.25-33 nm resolution, 4 spectra/day
Models Do Not Replace Measurements Can indirect measurements or models compensate for a lack of direct observations? • Models using sunspot area and faculae account for most of short-term variability • No model addresses potential long-term changes
Decompositions Based on Images Indicate Solar Causes Fontenla, White, Fox, Avrett, Kurucz., ApJ518, pp. 480-499, 1999 • Determine distribution and evolution of solar features from PSPT images • Use a semi-empirical model to synthesize the intensity from each feature • Combine the intensities to compute an irradiance spectrum
The TSI Climate Data Record Currently Relies on Continuity 0.9K 0.1K • Summary • Current instrument stabilities are adequate for discerning short-term climate sensitivity with continuity • Accuracies to maintain long-term record despite potential data gap have not yet been achieved • Ground-based calibration facilities will benefit future instruments and data record accuracy • The TIM’s 1361 W/m2 remains our best knowledge of TSI 0.7K Empirical Reconstruction courtesy Judith Lean, NRL
Measurements of Solar Irradiance: Conclusions • Solar Irradiance Uses • Total solar irradiance used for climate sensitivity studies by extending 30-year data record and understanding solar variability • Solar spectral irradiance measurements needed to model Earth’s atmospheric response and solar variability • Absolute accuracy of radiative balance • With TIMED, SORCE, and GOES we for the first time have complete and continuous spectral irradiance coverage... • ... and future EUV spectral irradiances from SDO and GOES-R will provide higher spectral resolution inputs for modeling and forecasting
Historical Solar Irradiance Measurements Solar Spectral Irradiance • Visible: GOME, SORCE SIM • MUV: Nimbus, SBUV, SME, UARS, GOME • FUV: OSO, AE-E, SME, UARS, SORCE • XUV/EUV: SOLRAD, AE-E, GOES, SNOE, TIMED SEE Total Solar Irradiance • NIMBUS 7 ERB • SMM ACRIM I • UARS ACRIM II • ERBS ERBE • SOHO VIRGO • ACRIMSAT ACRIM III • SORCE TIM
LISIRD LASP Interactive Solar Irradiance Datacenter http://lasp.colorado.edu/lisird/
Solar Irradiance Is A Boundary Condition based on Kiehl and Trenberth 1997 changes based on Coupled Climate System Models presented by W. Collins (SORCE Sci. Mtg 2006)
Composites Rely on Continuity and Stability Two primary TSI composites differ by 40 ppm/yr caused by 2 years of marginal quality data – not even a gap! ?