Download
1 / 9
90 likes | 96 Views
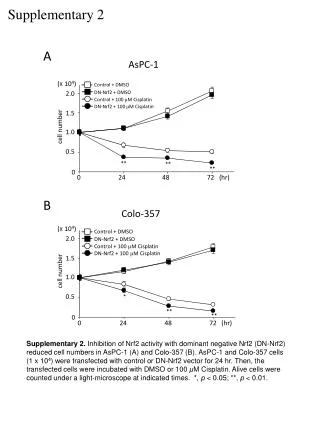
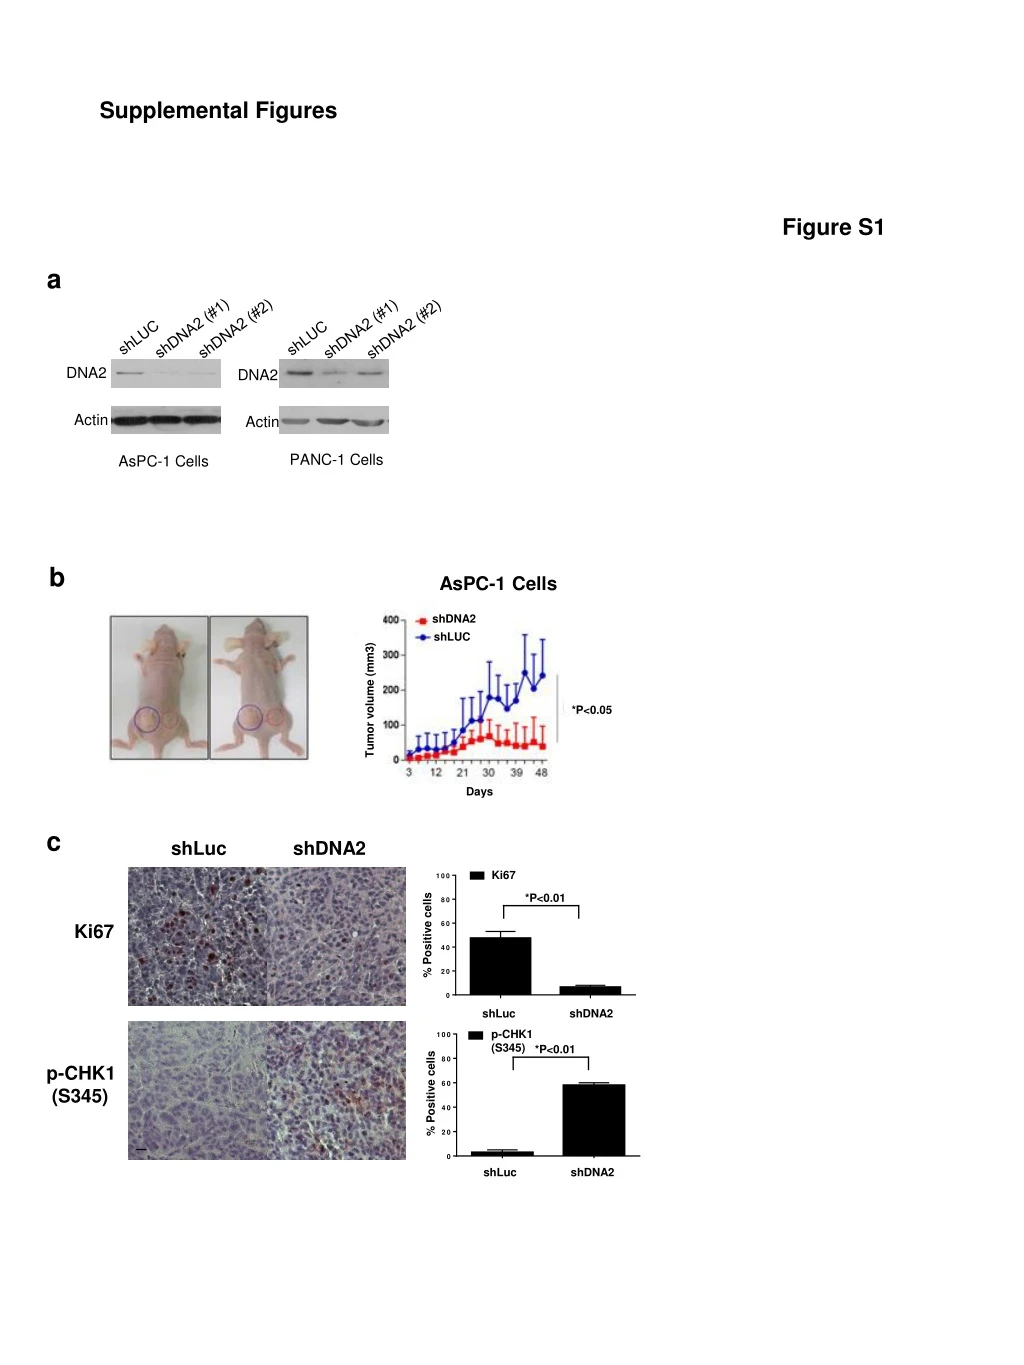
Supplemental Figures. Figure S1. a. shDNA2 (#1). shDNA2 (#2). shDNA2 (#1). shDNA2 (#2). shLUC. shLUC. DNA2. DNA2. Actin. Actin. PANC-1 Cells. AsPC-1 Cells. b. AsPC-1 Cells. shDNA2. shLUC. Tumor volume (mm3). *P<0.05. Days. c. shLuc. shDNA2. Ki67. *P<0.01. Ki67.

E N D
Supplemental Figures Figure S1 a shDNA2 (#1) shDNA2 (#2) shDNA2 (#1) shDNA2 (#2) shLUC shLUC DNA2 DNA2 Actin Actin PANC-1 Cells AsPC-1 Cells b AsPC-1 Cells shDNA2 shLUC Tumor volume (mm3) *P<0.05 Days c shLuc shDNA2 Ki67 *P<0.01 Ki67 % Positive cells shLuc shDNA2 p-CHK1 (S345) *P<0.01 p-CHK1 (S345) % Positive cells shLuc shDNA2
Figure S2 a b NSC-5195242 Time (min) 0 5 10 30 0 5 10 30 0 5 10 30 0 5 10 30 * * * Inhibitor Conc. (µM) 10.0µM 0.0µM 0.1µM 1.0µM No Inhibitor No Inhibitor NSC-105808 10 µM NSC-105808 10 µM NSC-105808 1.0 NSC-105808 Time (min) 0 5 10 30 0 5 10 30 0 5 10 30 0.75 0.0 µM 0.50 0.1 µM 1.0 µM 0.25 10.0 µM 10.0µM 0.1µM 1.0µM 0 0 10 20 30 Time (min) c d - - BLM - - + + + + + + RPA Double stranded DNA Fraction Unwound Single stranded DNA * * * DMSO 1.0 NSC-5195242 heat denatured NSC-105808 (20 µM) NSC-5195242 (20 µM) 0.75 0.0 µM BLM (nM) 0.50 0.1 µM e 1.0 µM 0.25 Exo1 10.0 µM f 0.6 Time (min) 0 5 10 30 0 5 10 30 0 0 10 20 30 Time (min) 0.4 Fraction Degraded 0.2 g h NSC-105808 (10 µM) DMSO - hDNA2 (D277A) 0 0 10 20 30 Time (min) DMSO DMSO NSC-5195242 NSC-105808 - + + + + + + + DNA2 NSC-105808 (10 µM) DMSO 10 µM NSC-5195242 DMSO DMSO NSC-105808 NSC-5195242 (10 µM)
Figure S3 a 4 µg NT 2 µg DNA2 Actin b 4 3 DNA2 expression fold change normalized to control 2 1 0 WT DNA2 over-expression (µg) NT 2.0 4.0
Figure S4 a b I-SceI endonuclease site GFP+ : 0.32% GFP+ : 20.05% GFP+ : 2.7% Si-Control Mock EGFP I-SceI DR-GFP iGFP GFP+ : 0.49% GFP+ : 21.38% GFP+ : 0.61% DNA double strand break induction by I-Sce1 DNA repair by HR Si-DNA2 Functional -GFP iGFP 1.5 si-DNA2 si-Ctrl 1.0 Fold Change in HR DNA2 0.5 β-Actin 0 si-DNA2 si-Control c 1.0 Fold Change in DNA2 level 0.5 si-DNA2 si-Control 0
Figure S5 a b Mock EGFP I-SceI I-SceI endonuclease site GFP+ : 0.03% GFP+ : 22.7% GFP+ : 2.75% Si-Control 5’-GFP 3’GFP GFP+ : 0.27% GFP+ : 19.75% GFP+ : 0.73% DNA double strand break induction by I-Sce1 DNA repair by Single Strand Annealing Si-DNA2 Functional -GFP 1.5 1.0 Fold Change in SSA si-DNA2 si-Ctrl 0.5 DNA2 0 β-Actin si-DNA2 si-Control c 1.0 Fold Change in DNA2 level 0.5 0 si-DNA2 si-Control
Figure S6 Mock EGFP I-SceI GFP+ : 0.02% GFP+ : 38.38% GFP+ : 2.22% DMSO GFP+ : 0.04% GFP+ : 39.34% GFP+ : 1.68% 0.15µM NSC-105808 GFP+ : 0.03% GFP+ : 39.27% GFP+ : 1.65% 0.3µM NSC-105808 GFP+ : 0.03% GFP+ : 37.89% GFP+ : 1.28% 0.6µM NSC-105808 1.0 Fold Change in SSA 0.5 0 DMSO 0.15 0.3 0.6 SSA in presence of NSC-105808 (µM)
Figure S7 a NSC-105808 0.15 µM 0.3 µM 0.6 µM MOCK 106 106 106 106 S 40.7 S 36.5 S 38.6 S 37.6 105 105 105 105 G1 31.7 G2 25.5 104 104 104 G1 23.3 G2 33.7 104 G1 29.2 G2 24.6 G1 33.5 G2 25.0 FL1-A (Brdu) FL1-A (Brdu) FL1-A (Brdu) FL1-A (Brdu) 103 103 103 103 102 102 102 102 300K 500K 700K 300K 500K 700K 300K 500K 700K 300K 500K 700K FL3-A (PI) FL3-A (PI) FL3-A (PI) FL3-A (PI) NSC-105808 b MOCK 0.15 µM 0.3 µM 0.6 µM 200 200 150 150 150 150 S 25.6 S 25.6 S 25.6 S 25.6 100 G1 37.3 G1 39.8 G1 37.3 G1 27.0 100 100 100 Cell count Cell count Cell count Cell count G2 36.0 G2 33.8 G2 37.9 G2 49.6 50 50 50 50 c 50 NSC-105808 0 0 0 0 40 300K 500K 700K 300K 500K 700K 300K 500K 700K 300K 500K 700K 300 FL3-A (PI) FL3-A (PI) FL3-A (PI) FL3-A (PI) 30 Percentage of cells in G1 20 10 0 MOCK 0.3 µM 0.6 µM 0.15 µM
Figure S8 a U2OS cell line Constant NSC-105808 (0.3 M) Constant time (4.0 hrs) NSC-105808 (µM) 0 0.15 0.3 0.6 Time (hrs) 0 4 8 12 DNA2 DNA2 ACTIN ACTIN 2.0 1.2 1.6 0.8 1.2 DNA2 expression normalized to Control DNA2 expression normalized to Control 0.8 0.4 0 0.15 0.3 0.6 M 0.4 0 0 Time (hrs) 0 4 8 12 NSC-105808 (µM) 0 0.15 0.3 0.6 b PANC-1 cell line Hs578T cell line Constant NSC-105808 (0.3 M) Constant NSC-105808 (0.6 M) Constant time (4.0 hrs) Constant time (4.0 hrs) DNA2 DNA2 NSC-105808 (µM) 0 0.15 0.3 0.6 NSC-105808 (µM) 0 0.15 0.3 0.6 Time (hrs) 0 4 8 12 Time (hrs) 0 4 8 12 ACTIN ACTIN 1.2 1.5 0.8 DNA2 expression normalized to Control DNA2 expression normalized to Control 1.0 0.4 0.5 0 0 Time (hrs) 0 4 8 12 NSC-105808 (µM) 0 0.15 0.3 0.6 c DNA2 DNA2 ACTIN ACTIN 1.2 1.2 0.8 0.8 DNA2 expression normalized to Control DNA2 expression normalized to Control 0.4 0.4 0 0
Figure S9 a HPDE MCF10A Dox - + - + b RAS Actin HPDE Dox+ HPDE Dox- Survival rate normalized to NT 1 µM NT 0.5 µM 0.25 µM 0.125 µM c HPDE Mock Dox- NSC-105808 0.25µM Mock HPDENSC-105808 Dox- HPDE Mock Dox+ HPDE NSC-105808 Dox+ Dox- Colonies normalized to Mock Dox- Dox+ *:p<0.05 HPDE Mock Dox- HPDENSC-105808 Dox- HPDE NSC-105808 Dox+ HPDE Mock Dox+