Download
1 / 119
1.19k likes | 1.2k Views
This report has been prepared by Oxfam India. It has benefited from extensive discussions with Amitabh Behar. Professor Jayati Ghosh and Professor Sandip Sarkar provided critical inputs at various stages of the report as peer reviewers which greatly improved the quality of the report.

E N D
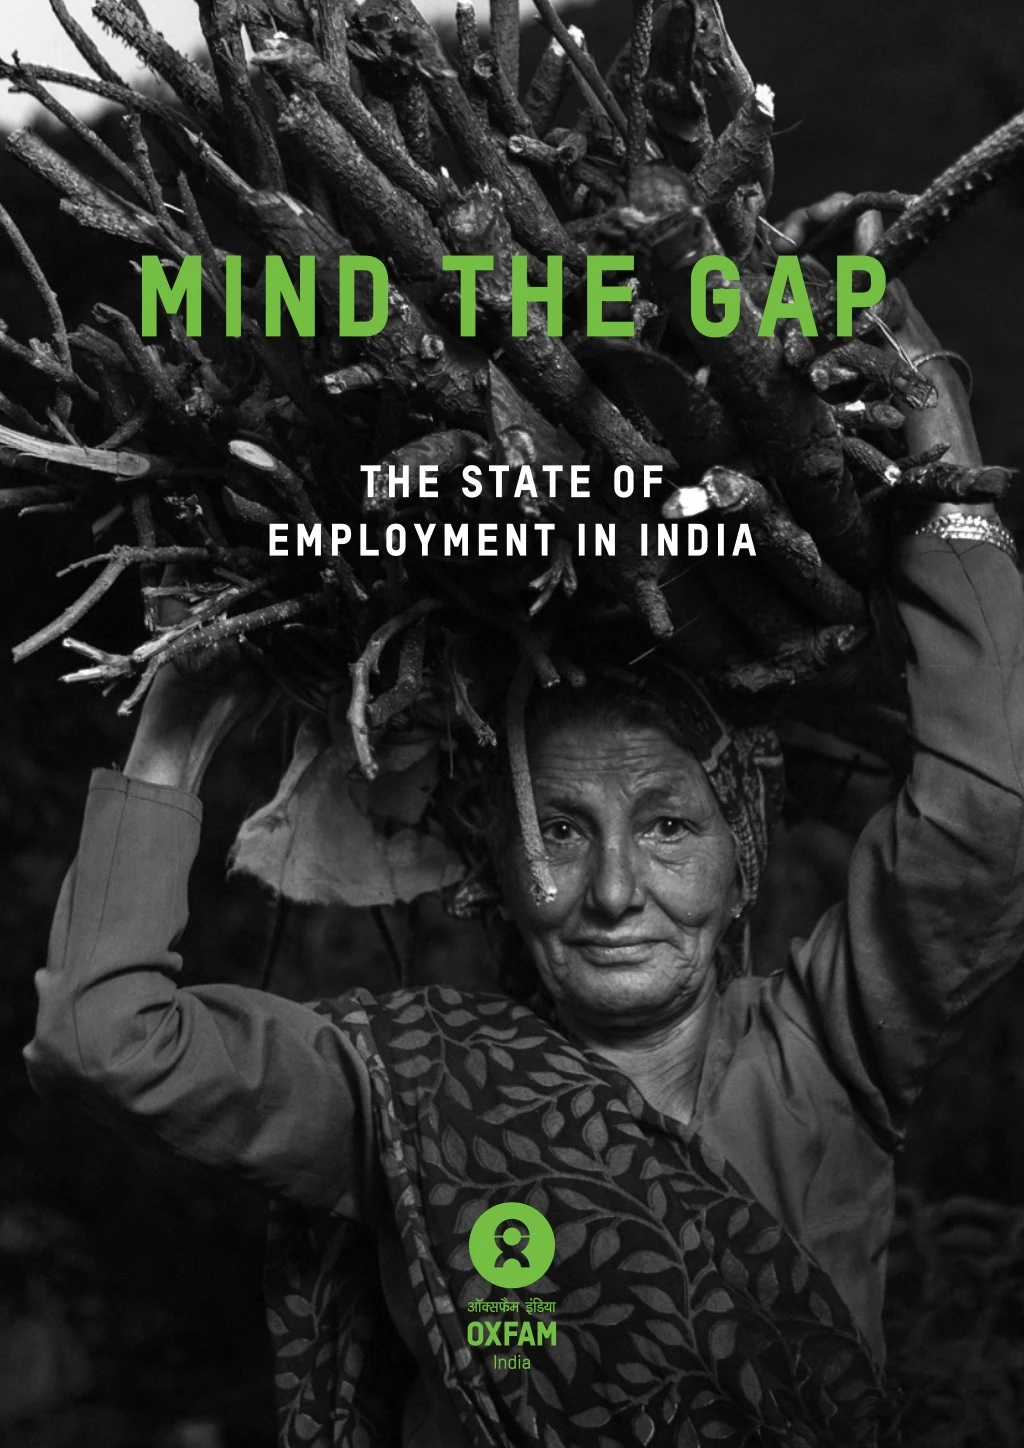
MIND THE GAP The State of Employment in India 1
MIND THE GAP The State of Employment in India 2
Acknowledgments CONTENTS This report has been prepared by Oxfam India. It has benefitted from extensive discussions with Amitabh Behar. Professor Jayati Ghosh and Professor Sandip Sarkar provided critical inputs at various stages of the report as peer reviewers which greatly improved the quality of the report. We would like to thank Centre for Policy Research for the extensive research support provided in preparation of the report. Oxfam India would like to thank all contributing authors—Ishita Mehrotra, Sumeet Mhaskar, Shamindra Nath Roy, Partha Mukhopadhyay, Vaibhav Raaj, Ravi Srivastava, Tomojit Basu, Sakti Golder, Savvy Soumya Misra and Diya Dutta for their continuous engagement with the report. We also thank the Institute for Governance, Policies and Politics (IGPP) for conducting the primary survey for the Unpaid Care Work study; Kumar Rajesh for his contribution to background research; and Arushi Dubey for helping out with data for the report. We also acknowledge the support of Priyanka Sarkar for editing the report and Anandita Bishnoi for designing the report. Finally, but not the least, Oxfam India would like to thank for the support provided by its team members, Tejas Patel, Himanshi Matta and Rahul Sharma. List of Tables List of Figures List of Boxes i ii iv The State of Employment in India: What the Report Says Diya Dutta 01 1. Wage Inequality and Minimum Wages In India: Widening Gender Wage Gaps Sakti Golder 14 2. Inequality and Rural Employment: Agrarian Distress and Dalit Women Ishita Mehrotra 3. What Matters for Urban Women’s Work: A Deep Dive Into Female Labour Force Participation Shamindra Nath Roy and Partha Mukhopadhyay 40 62 4. No Work Is Easy!: Notes from the Field on Unpaid Care Work for Women Diya Dutta 98 Ranu Kayastha Bhogal Commissioning Editor 5. Labour Law Reforms in India: A New Social Contract? Vaibhav Raaj 126 6. Inequality in the Formal Manufacturing Sector: Examining contract labour dynamics, wage differentials and social security Tomojit Basu 154 7. The State of Stigmatized Employment in India: Historical Injustices of Labouring Sumeet Mhaskar 180 8. Inequality and Social Security In India: Proposed Changes in Labour Code Explosive or a Whimper? Ravi Srivastava 200 List of Contributors Peer Reviewers Commissioning Editor 222 224 224
TABLES Table 1.1 Real average daily wages and average annual wage growth of rural and urban workers Table 6.6 Per worker PF and other Benefits Spends across Industries (2005-06 v. 2015-16) 19 171 Table 1.2 Real average daily wages and average annual wage growth of regular and casual workers Table 8.1 Percentage of Workers by Availability of Job Contract and/ or Social Security 20 205 Table 1.3 Average daily wages, by sub-group and gender, 2011-12 (INR in Nominal terms) Table 8.2 Percentage of Informal/Formal Workers in Formal and Informal Sectors by Industry-group 21 206 Table 1.4 Gender Wage Ratio, by Occupation, 1993-94 to 2011-12 Table 8.3 Expenditure (In INR crores) on Social Security Schemes 2012-13 to 2018-19 23 214 Table 1.5 Growth rate of agriculture and non-agricultural casual workers’ wages (%) 24 Table 1.6 Wage ratios between organized and unorganized workers, by economic sectors Figures 26 Table 1.7 Real average daily urban wages by type of worker, 2004–05 and 2011–12 (INR, base year 2011–12) 28 Figure 1.1 Ratio of Average Daily wage of a Female worker to a Male worker (in 2011-12) –Urban Workers 22 Table 1.8 Real average daily rural wages by type of worker, 2004–05 and 2011–12 (INR, base year 2011–12) 28 Figure 3.1 Rural-Urban Distribution of FWFP 70 Table 1.9 Violation of Minimum Wages in the MGNREGA 31 Figure 3.2 Spatial Distribution of Urban FWFP (All Ages) 70 Table 3.1 Measures of FWFP across Various Datasets 71 Figure 3.3 Correlation of Full-Time Workers 72 Table 3.2 Top ten industries of Women’s work 76 Figure 3.4 Correlation of All Workers 72 Table 3.3 Association between married women and their husband’s Industry of work 87 Figure 3.5 Distribution of different FWFP estimates across various settlements (15-59 yrs.) 74 Table 6.1 Share (%) of contract workers in total workers by industry 162 Figure 3.6 Share of Top Ten Industries and Predicted FWFP 77 Table 6.2 Ratio of contract worker to permanent worker wages by industry 165 Figure 3.7 Where the model fits well and where it doesn’t 77 Table 6.3 Average daily real wages by worker segment (2004-05 to 2011-12) 166 Figure 3.8 Difference in share of Workers by Industry (SC and Non-SC/ST) 78 Table 6.4 Trends in no. of managerial/supervisory staff v. all workers 167 Figure 3.9 Occupational Classification of Workers by Social Groups in Construction 79 Table 6.5 Share of wages of Managers/Supervisors v. Workers (2005-06 to 2015-16) 169 i ii
Figure 3.10 Education (Females) Figure 6.3 Trends in no. of managerial/supervisory staff v. all workers (2005- 06 to 2015-16) 80 168 Figure 3.11 Education (Males) 80 Figure 8.1 Percentage of Workers by Social Group with Access to Social Security, 2011-12 207 Figure 3.12 Health (Females) 81 Figure 3.13 Health (Males) Figure 8.2 Percentage of Workers by Religion with Access to Social Security, 2011-12 81 207 Figure 3.14 FWFP by Consumption Quintiles 83 Figure 8.3 Percentage of Workers by Sex with Access to Social Security, 2011-12 208 Figure 3.15 Share of Self-employed women by Consumption Quintiles 83 Figure 8.4 Percentage of Workers by MPCE Quintiles with Access to Social Security, 2011-12 208 Figure 3.16 Share of Unpaid family workers and Casual Workers by Consumption Quintiles 83 Figure 8.5 Social Security Expenditure as % of GDP & Total Expenditure 83 215 Figure 3.17 Share of Salaried Women by Consumption Quintiles Figure 3.18 Industry of work by education of married women (15-49 yrs.) 85 boxes Figure 3.19 FWFP by Husband’s Education 85 Figure 3.20 Nature of Work by Husband’s Education 86 Figure 3.21 FWFP of Married Women and Nature of work of wives by Industry of Work ofHusband 88 Box 3.1 Who Works More? 65 Box 3.2 Does Religion Matter 73 Figure 3.22 Urban FWFP by Type of Household in terms of children and Marital status 89 Box 3.3 Manufacturing or Services: Where is the Potential for Women’s Work? 75 Figure 3.23 Extent of Work by Age of Child 90 Box 3.4 Costs and Benefits of Multiple employers: Domestic work in India 84 Figure 4.1 Women Seeking Work/ Available for Work in Rural India 111 Figure 4.2 Women seeking work/available for work in Urban India 112 Figure 4.3 Social Norms, Women’s Unpaid Care Work and Gender based Violence 115 Figure 6.1 Total growth in percentage of contract workers in formal manufacturing 163 Figure 6.2 Trends in top 10 contract labour hiring industry segments (2005-06 to 2015-16) 264 iii iv
THE STATE OF EMPLOYMENT IN INDIA THE STATE OF EMPLOYMENT IN INDIA WHAT THE REPORT SAYS By DIYA DUTTA 10 1
THE STATE OF EMPLOYMENT IN INDIA Overview OVERVIEW what the report says Oxfam India released its first India Inequality Report in February 2018. This is an input for the global Even It Up! Campaign of Oxfam which is the inequality campaign. The first India Inequality Report 2018 authored by the well-known economist Himanshu, discussed the fundamentals of inequality in India. It stated that contrary to common perception, India is a highly unequal country on all counts of inequality. This means that inequality in India is multi-dimensional. There are inequalities in wealth, income and consumption, as well as structural inequalities of opportunity, region and social groups. within a decade it increased to more than one- third. Contract workers not only suffer from the insecurity of tenure but are also paid less with no social security benefits. aided the existing capital accumulation process, by allowing heavy corporate tax exemptions, appropriation of land and natural resources and by lax implementation of regulations. section of unskilled labour. The ASI data sheds light on declining gains to workers even though productivity has increased in manufacturing. While wage share was higher at around 30 percent in the early 1980s with profit share at only 20 percent, the shares changed after 1990s. In recent years, the share of profits in net value added has increased to more than 50 percent reaching a peak of more than 60 percent in 2007-08. While it has declined after the financial crisis, it continues to be above 50 percent of net value added in organized manufacturing. During the same time, the share of wages in value added declined to 10 percent and has remained thereabout in recent years. The ASI brings out the emoluments received by various categories of workers. In the organized manufacturing sector, while workers’ wages and emoluments of managerial staff were moving in tandem until the 1980s, they start diverging from the early 1990s and have continued to diverge further. By 2012, the last year for which data is available, managerial emoluments increased by more than 10 times but workers’ wages have increased by less than 4 times. The current report discusses in detail the crisis in the organized manufacturing sector but goes beyond and brings together the work of Oxfam India and sector experts on labour and employment to generate discussion around the State of Employment in India. It is topical as five years since the NDA II came to power, it is time to assess its scorecard on the jobs promises. The central thrust of all the chapters revolves around decent work or the lack of it and state-sponsored inequalities that are exacerbating problems of income and employment inequality in the country. This particular report Mind the Gap: The State of Employment in India is building on the first report launched in February 2018. The first India Inequality Report, Widening Gaps (2018) stated that over the years, successive government policies favoured capital over labour. The nature of production in the organized manufacturing sector has also changed, with increasing share of profits and declining share of workers’ wages in the net value added. Real wage growth in India has remained stagnant at a 1 percent annual rate between 1983 and 2013 as per the Annual Survey of Industries (ASI), 2015. Second, as globalization and neo-liberal economics took root, within labour, there was higher demand for skilled labour as opposed to unskilled labour neglecting sectors such as agriculture which employed a large In addition to the decline in the quality of employment over the last two decades, the decline in the number of jobs created and the skewed distribution of workers across sectors have contributed to rising inequality. These labour market outcomes are primarily a result of the fact that the gain from growth have been unevenly distributed, due to the nature of the growth process. Massive capital inflows after 1991 set off a domestic retail credit boom and along with fiscal concessions, this created an environment for a hike in consumption of the better-off households, which has enabled the rapid growth of Gross Domestic Product. However, the consumption demand of the masses has remained low. Successive governments have Job creation and employment are key issues in fighting inequality. The first India Inequality Report observed that there is now growing concern that the development trajectory in the post-liberalization era has been a period of jobless growth. Despite a booming economy and increasing labour force, the process of job creation has been extremely sluggish. The outcomes on distribution of income and wealth are strongly linked to the processes in the labour market. There has been a sharp increase in the employment of informal workers in the organized sector, particularly in the private organized sector. The share of contract workers to all workers being employed was less than 20 percent in the beginning of this century. But Specifically, the report analyses the state of employment in India from the lens of gender. Women’s labour force participation in India is one of the lowest in the world. Women comprise half of the Indian population but make up less than a quarter of the labour force. Three in four Indian women do not work in the country (Garg and Shahi 2018). Looking at the extremely low levels of participation of women in the labour market makes one wonder whether the phenomenal success of India’s economic transition forgot about its women and left them behind. This is an issue of inclusion and inequality of the labour trajectory in the country. Gender wage 2 3
THE STATE OF EMPLOYMENT IN INDIA Overview gaps in India are highest in Asia—women are paid 34 percent less than men in the country for performing the same job with the same qualifications. had exercised their choice in deciding who to marry. Early age at marriage and childbirth has anecdotally emerged as a challenge to women joining the workforce (Garg and Shahi 2018). workers there exists a huge wage gap. Golder’s analysis demonstrates that a large majority of workers in the Indian labour market still have low wages and lack job security and social protection. Golder directs attention to how wage inequality is determined by level of education, gender, category of workers, between agricultural and non-agricultural workers, organized and unorganized sector, and social background. lowering of wages in the states’ race to the bottom for attracting investments. We then move to a specific discussion on the distress in agricultural employment and which is primarily a female problem in the Chapter Inequality and Rural Employment by Ishita Mehrotra. Accessing stable, productive and well- paying jobs through the labour market is an important avenue out of poverty. This chapter looks at how this story has played out in the Indian countryside, with a focus on female labourers. While inequality in jobs has increased, inequality in education has decreased between boys and girls. But this situation further exacerbates the crisis in jobs when it comes to women. Almost all girls go to primary school and 70 percent of girls between the age of 15 to 18 years are enrolled in school. They frequently outperform boys in secondary and senior secondary examinations (Desai 2019). But the denouement is not favourable for women—they are not finding suitable jobs for the skills that they have. There are economic and structural reasons behind high unemployment among women and why women even stop looking out for a job. This report focuses on some of these specificities of low labour force participation of women in India. We begin with Wage Inequality and Minimum Wages in India by Sakti Golder. Golder argues that income inequality gets corroborated by the movement of wages. Further, inequalities within various category of workers, reflected in ‘wage inequalities’, often contribute to overall inequality to a significant extent. If there is an increase in minimum wage level, the workers at the bottom strata benefit and it leads to increase in their wage earnings and may reduce wage inequality. Further on, in the chapter on Inequality and Rural Employment, Ishita Mehrotra informs how Dalit poor women are forced into bonded labour due to the economic structure of the rural economy. There are gross violations of minimum wages and working conditions that are a worrying concern. Later on, Vaibhav Raaj, in his analysis of the Draft Code on Wages 2017 opines that decriminalizing non-payment of wages and bonuses amounts to a softening of approach of the government on the issue of forced labour. At the end of the first two decades of this millennium, what we see in our country is that despite high growth rates, jobs remain a huge challenge for India. This has to be understood with reference to the lopsided nature of Indian growth. The services sector accounts for more than half of India’s GDP, but does not make a significant contribution in employment generation. While the share of agriculture in GDP has fallen over the years to about 14 percent presently, almost half the workforce (about 49 percent) still directly or indirectly depends on agriculture for livelihoods. Moreover, according to a NCEUS report (2008), in the early 2000s when India reported about 8 percent growth rate per annum, 77 percent of the population was poor and vulnerable. In fact, according to an ILO report (2016), overall rural employment grew at an average of less than 1 percent per annum in the period 1999-2000 and 2011-12. Simply put, India is recording high growth but at the same time large sections of its citizenry are struggling to survive on the margins. Against this backdrop, it would be worthwhile to mention that when Product (GDP) grows faster than total labour compensation, the share of labour income (also called the ‘wage share’) falls relative to the capital income share (also called the ‘share of profit’) and it ultimately, leads to income inequality. In addition to the reduced share of wages in national income, several other factors, namely, wage differences across regions, gender pay gaps, wage differentials between contractual and regular employees, and wage differential across sectors (formal/informal and agricultural/non- agricultural), social background (caste/religion) are the important factors of wage inequality in India. As wages are the most important factor for the whole section of the wage earners and their families for maintaining a living standard, increasing real wages and moderating wage inequality would ultimately lead to reducing the overall inequality in India. Gross Domestic Young men with Class 10 or 12 education find jobs as mechanics, drivers, sales representatives, postmen and appliance repairmen. Few of these opportunities are available to women. Employment for women are available in farm sector as labourers or as manual labourers in non- farm construction sector. These have little appeal for girls with secondary and higher secondary education (Ibid). Further, civil action is less likely than criminal action to deter labour rights violations. The denial of the right to representation by an advocate is a direct violation of the provisions of the Advocates Act, 1961. The government being one of the largest employers in India, the provisions of the Code effectively deny justice to millions of workers by exempting the government from the requirement of providing timely wages. Women drop out of the labour force because of the high burden of unpaid care work in households which is overwhelmingly a female responsibility. There are also social barriers to women’s mobility outside the house which prevents them from engaging in paid labour. There are social constraints on owning land, whereby although an overwhelming number of women are responsible for farm activities in rural India, the ownership and control over land and income from land is controlled by men. According to IHDS 2012 data (Garg 2017), only 5 percent of women in India The Code recommends the fixing of a national minimum wage by the Central Government. However, it also allows differentiated levels of the national minimum wage for different states or geographical areas. Figures provide one side of the story. In a country like India which is characterized by deep inequalities, labour markets cannot be understood solely in an economic sense with reference to percentage of employment created, The provisions of the Code allowing different national minimum wage levels in different areas are self-defeating and essentially promote Remunerations are better in the organized sector, but only for regular workers. Even within regular 4 5
THE STATE OF EMPLOYMENT IN INDIA Overview poverty effects, extent of unemployment or underemployment, wage rates, etc. Labour markets, especially rural labour markets, are arenas of social relations where unequal power relations are a norm. Labour relations are based on a political economy of difference—of caste, gender, religion, region, asset base, capabilities, etc. These influence who can access what type of jobs, under what terms and conditions and with what labour market outcomes. Discrimination actually starts before one even enters the labour market. from 73.7 percent in 1993–94 to 59.4 percent in 2011–12. Dependence on agricultural employment is, however, a gendered phenomenon. Another study says that almost 75 percent of rural women are still engaged in agriculture. workforce participation and contrary withdrawal from the labour force. Specifically, they focus on the urban non-farm sector. Their chapter demonstrates that a person’s location, industrial structure, the caste one is born into, income levels, education and family structure, and the presence of children, especially small children in the household matter when it comes to women’s workforce participation in India. female and male labour force and workforce participation. Even though there is variation across the country, the participation rates of women in the workforce is low by international standards even in locations where it is relatively high in our context. Yet, it is important to pursue this, because the benefits are many and multi- faceted—ranging from economic advancement to a social environment that is more nurturing and facilitative for all genders, for this inequality is as much a loss for men as it is for others. Both men and women are diversifying out of agriculture, men more than women though. Such feminization of agriculture is not to be celebrated. A patriarchal ideology and local socio-cultural traditions confine women to the village where agriculture continues to be their most important (but insufficient) source of food and income. Male outmigration has also pushed women into taking on more responsibility of own cultivation and to perform wage labour to ensure daily households’ survival. In a situation of declining agricultural employment without a corresponding increase in rural non-farm jobs, women are the worst affected. Lack of basic amenities and safety concerns also impede women’s mobility. Declining female work participation rate is also indicative of the lack of skill training and employment opportunities that can be combined with care and reproductive economy responsibilities in addition to that of own cultivation. The explanations of low and declining Female Labour Force Participation (FLFP) in India focus around the helix of cultural constraints and low returns from work. Factors such as education— both self and husband’s, lack of skills, the competing responsibility of family care work, and social disapproval of working women are advanced as important cultural constraints of FLFP. Concomitantly, issues of lower wages, low infrastructure provision, declining returns from agriculture and fragmentation of land and lack of ‘suitable work’ reduce the returns from work. Depending on the viewpoint, the policy discourse also varies; those privileging cultural explanations anticipate a slow change, while others argue that the solution lies in redressing structural constraints. This chapter tries to look a little deeper into this debate, to unpack viable interventions that could encourage more women to join the labour force. India’s working poor (just under 60 percent taking USD 2 as poverty line) are characterized by structural inequalities, degrees of informality, low wages, little or no social protection, very low levels of education, skills and health. There is a strong correlation between poverty and social identity. India’s poor are also more likely to be Dalits, Adivasis, Muslims and then OBCs. Clearly then, India’s growth has been unequal and based on exclusions. Underlying the distress that women workers face in rural agrarian economy or why women drop out of the labour force in large numbers, is the issue of overwhelming burdens of unpaid care and domestic work that women have to undertake. The chapter, No Work Is Easy! by Diya Dutta looks into the specificities of why women are unable to participate in the labour force, or where they do, they are burdened with excessive time poverty. This chapter is based on primary field research undertaken in the states of Bihar, Jharkhand, Uttar Pradesh and Chhattisgarh. While India’s regional diversity precludes a uniform picture, the unpacking of agrarian neoliberal agenda, together with other historical changes relating to technological developments, changes in cultivation practices, fragmentation of landholdings with successive generations, etc., have culminated in a situation of rural distress and agrarian crisis with its class, caste and gender specificities. Small and marginal farmers (about 80 percent) and agricultural labourers are most affected by the agrarian crisis; a majority of them are Dalits, Adivasis; and unlike men, women labourers continue to be concentrated in agriculture due to socio-cultural restrictions and lack of appropriate alternate employment opportunities in villages. While unpaid care and domestic work is a global phenomenon, it is especially acute in India, where women’s unpaid care and domestic work hours are second only to women in Kazakhstan whose GDP is one-sixteenth that of India. Having introduced the problem that manifests itself among women workers in this country, we now move on to a central issue of this report, the decline in female labour force participation. Shamindra Roy and Partha Mukhopadhyay in their chapter, What Matters for Urban Women’s Work undertake original analyses based on four publicly available data sets: (a) the various Economic Tables (B-series) and Primary Census Abstract of Census of India 2011, (b) NSS Employment-Unemployment Survey 2011-12, (c) IHDS panel and IHDS-II survey of 2011-12, and (d) NFHS-IV survey of 2015-16. They explore the different determinants that shape women’s In consonance with Golder’s argument, Roy and Mukhopadhyay discuss established arguments on declining FLFP—that of wages. They argue that there is also wage discrimination, where similarly qualified women are paid less than men—a third less by some estimates (ILO 2018)— for similar jobs. This issue is taken up in detail in Golder’s chapter. Few contradictory trends have been witnessed in India since the beginning of the millennium. Since 2004-05, India’s GDP scripted its highest growth ever, since the economic reforms began in 1991. At the same time FLFP declined sharply. In India, women comprise half of the population, but less than a quarter of women—23.7 percent participate in the labour market—both in organized and unorganized sectors. Further, despite the drop in FLFP, women’s time poverty increased manifold. Agriculture is no longer the mainstay of rural livelihoods. Various studies show that the share of total employment in agriculture fell sharply, They conclude that there are no silver bullets or simple answers to mitigate the inequality between 6 7
THE STATE OF EMPLOYMENT IN INDIA Overview Economic growth is gender blind and while it has, in the past, created some employment opportunities, these opportunities were super- imposed on a social fabric that was gender unequal and indisposed towards women. Unpaid care and domestic work fall within this ambit of gender inequality leading to unequal opportunities for women in the labour market. For example, between 2000 and 2005, 60 million jobs were created in total, but women lost out as 14.6 million of those jobs were attributable to a rise in rural female unpaid family workers in the agriculture sector. This is because most of the paid jobs went to men and the unpaid jobs were left for women to take up. According to one study, women in India do almost 10 times as much unpaid work as men. It is estimated that if this unpaid care work is recognized and there is direct public investment in the care economy of 2 percent of GDP, then India will create 11 million new jobs. Mehrotra in her Rural Employment chapter talks about how outmigration is linked to withdrawal of women from wage labour and them bearing the uneven burden of unfree labour relations. Returning migrants, she says, do not want their women to continue working in the field of upper caste-classes because it is a reflection on their honour and pride—that as breadwinners they could not provide for their families. Dutta in her field study, encountered such women too. Such women were engaged in status generation, not necessarily of themselves but of their families. They bore the excessive burden of unpaid care work and the leisure time that they managed was not indicative of their improved status within the household but of a further weakening of their decision-making power in the absence of the opportunity to work and earn an income. books or accounts. The truth is massive people are being employed.’ In other words, informal self- employment must be counted as ‘respectable’ employment generated by the economy. estimated that nearly 9 out of every 10 persons of Scheduled Castes (SCs) and Schedule Tribes (STs), 8 out of every 10 OBCs (except Muslims), more than 8 out of every 10 Muslims (except SCs and STs) and more than 5 out of every 10 other persons (excluding SCs/STs, OBCs and Muslims), belonged to the ‘poor and vulnerable’ in India in 2004-05. This poor and vulnerable category was a sum total of the ‘extremely poor and poor’ and ‘marginal and vulnerable’ categories—overall living on less than USD 2 (at PPP terms) per day in 2004-05. That this poverty and vulnerability has a social character is amply clear from the NCEUS data where the dalits, adivasis, OBCs and Muslims are 25 to 30 percent more likely to be poor and vulnerable than other social classes. Of the total population in this category, nearly 79 percent could be classified as unorganized workers. In the years since the NCEUS findings of 2004-05, latest available data shows that the disparity in incomes for most social groups and women has either increased or remained stagnant. In effect, this assertion can be read as a statement of the government’s policy approach to labour in the following manner. Informality, particularly with regard to job and income security, is not necessarily undesirable. Underemployment in the form of self-employment is acceptable if promoted as entrepreneurship. The traditional methods of estimating employment-generation are redundant for they fail to account for such entrepreneurial self-employment. Income that borders on the international poverty line of USD 1.90 (INR 121.37) is also acceptable. And by implication, people can create their own employment if left to the market; the government has only a supportive role. Second, negative social norms bind women and girls deeply to their domestic work duties. So while it is true that more and more girls are enrolled in schools, their unpaid care and domestic work responsibilities lead to extreme time poverty. The chapter is based on four hypotheses stemming from a paper written by Santosh Mehrotra and Sharmistha Sinha in 2017. The chapter hypothesises that (i) with girls enrolled in schools, adult women face increased burden of domestic work as the young girls are unable to lend a helping hand; (ii) over a 5-year period, women’s unpaid care and domestic work has increased manifold which is preventing them from participating in the labour market; (iii) due to increasing nuclearization of households, there are fewer adult women to lend support to unpaid care and domestic work putting greater pressure on single/fewer women to perform these tasks; (iv) how fiscal policies such as the Ujjwala Scheme and the National Drinking Water Programme could help achieve gender equality and improve women’s labour force participation in India. It remains to be seen how unprotected informal employment can contribute to meet the objectives of the ‘decent work’ agenda embedded in the Sustainable Development Goal 8 of the United Nations. This combined with SDG 10 on inequality makes for a volatile situation. This chapter focuses on underscoring that structural inequalities rooted in caste, gender, religion make imperative the redressal of such inequalities through labour market regulation. It offers a critical assessment of the draft Labour Codes under debate at present and highlights the positives and challenges of the current form of the codes if implemented through law. Roy and Mukhopadhyay found that women with small children showed a slight tendency towards shift from full-time to part-time work. In Dutta’s study, it was also evident, that high burden of unpaid care and domestic work including child minding encouraged women to seek part-time and home-based work so that they were better able to juggle their unpaid care work and income generating work responsibilities. In India, economic categories and social categories overlap. Thus, Raaj states that the pakoda-sellers of India belong to the policy category of street vendors. They also largely belong to another key administrative category used for affirmative action measures—the Other Backward Classes (OBCs). The informal workers not only suffer poor conditions of work, but also lack access to comprehensive social security. In the chapter on Inequality in the Formal Manufacturing Sector by Tomojit Basu, Basu states that the structure of employment in the country’s organized (or formal) manufacturing sector has changed considerably since the economic reforms of 1991. Contract workers have increasingly substituted permanent (or directly hired) workers to the extent that the former now make up more than a third of all workers in formal manufacturing. Vaibhav Raaj’s chapter on Labour Law Reforms in India invokes a recent speech delivered by the Prime Minister of India. In January 2018, the Prime Minister of India asserted: ‘If someone opens a “pakoda” shop in front of your office, does that not count as employment? The person’s daily earning of INR 200 will never come into any The National Commission for the Enterprise in the Un-organised Sector (NCEUS) 2007 report found that almost 8 out of 10 Indians lived on less than INR 20 a day (USD 0.28 a day). Further the report Among the findings, there is resonance with discussions in other chapters: For example, 8 9
THE STATE OF EMPLOYMENT IN INDIA Overview Unfair terms of service, low remuneration and wage inequality for casual workers was flagged by the International Labour Organization (ILO) in the India Wage Report released in August 2018. Using national data from the government’s National Sample Survey Office’s Employment and Unemployment Surveys, it estimated that 62 percent (121 million) of India’s employed population were casual workers which included contract workers. Despite 7 percent annual average GDP growth over the last two decades and a doubling of real wages between 1993-94 and 2011-12, the report stated the Indian labour market continuing to be characterized by ‘high levels of segmentation and informality’. This chapter, thus, attempts to capture the reasons for the shift to contractual workers and highlight key wage trends within organized manufacturing using secondary literature and analysis derived from ASI data between 2005-06 and 2015-16. security coverage as well as the growing share of wages accruing to the managerial class appears to be furthering a race to the bottom of the wage ladder. This ultimately hinders vertical mobility for Indian workers. Further, the erosion in bargaining power for permanent workers as a fallout of the changing dynamics of India’s labour market is a dimension that requires greater scrutiny. There is definitely a case to be made for decent work and fair wages for Indian workers employed in formal manufacturing. the state’s response in terms of policies designed to address the working and living conditions of those engaged in the stigmatized occupations. What factors explain stigmatized occupations in India? Which social groups are engaged in each of the stigmatized occupations? What are the factors that prohibit the state and society to put an end to these inhuman and hazardous occupations? the persistence of Like Raaj’s chapter, Basu analyses two labour laws that impact inequality in organized manufacturing sector. These are the Industrial Disputes Act (1947) and The Contract Labour (Regulation and Abolition) Act (1970). Poor investment in education by the state is leaving the masses with inadequate qualifications and skills to take on better quality jobs in the country. The case of stigmatized employment is a classic example of this condition. Thus Mhaskar argues that the role of social institutions continues to remain relevant for an individual’s access to occupational choices. More crucially, past discrimination has a bearing upon the present day inequalities faced by marginalized groups that is revealed by the ghettoization of occupational choices for socially marginalized groups. State agencies too have contributed to the perpetuation of these inequalities by failing to provide quality education and access to various resources to these historically disadvantaged groups. Much has been said on the issue of decent work. Yet, this is a country, where one’s caste, class, religion and gender determine what kinds of work one can and one cannot do. This forms the subject of discussion in the next chapter by Sumeet Mhaskar on The State of Stigmatized Employment in India. While employment flexibility is likely to remain a core issue in the organized manufacturing sector, Raaj opines that a necessary fallout of flexibilization is the weakening of trade union movements in India. The trajectory of reforms reflects a tendency towards large scale deregulation on the one hand, and stricter state control over trade unions on the other. Providing for very stringent norms for the governance of trade unions through the Labour Code on Industrial Relations (LCIR) 2015, can easily become the means for interfering with union activities. In fact, while the registration of a trade union for the unorganized sector may become easier, the cancellation of a union’s registration in any sector can be even more swift under the LCIR. Further, the intent of pre-empting and preventing almost all forms of collective actions by organized labour is amply clear in the LCIR and the Small Factories Bill, 2014. The LCIR reverses the barriers to retrenchment and layoffs put in place by the 1982 amendment to the Industrial Disputes Act. Moreover, it legitimizes fixed term employment. For smaller factories, closures are to be made much easier. Increasing ‘informalization’ (or casualization) of the workforce, among other factors, stymies India’s ability to pursue inclusive growth. Contractualization, both within the organized and unorganized manufacturing sectors, has contributed to limiting inclusive economic growth by widening wage inequality even if wages have grown at a faster clip for contract workers over the last decade. Social protection and collective bargaining for and by workers has also suffered due to labour casualization since contract workers are likely to be fired easily and are not covered by various legislative provisions. Labouring in India has been historically linked with social institutions such as gender, caste and religion. These institutions have played a crucial role in assigning occupations to individuals based on their membership to the jatis (sub-castes) they are born into. Individual membership to the jatis decided what occupations one can do and most importantly what one cannot do. The transformations in social, political and economic spheres resulted in the constant reworking of these institutions. Notwithstanding these transformations, socially disadvantaged groups continue to face barriers from entering into occupations that were carried out by the privileged social groups. As a result, the former were compelled to work in stigmatized occupations. Coming back to Raaj’s contention about how the current government discouraging secure jobs with social security benefits, Mhaskar opines that given the perennial nature of work, the overwhelming majority of the sanitation workers should have been part of the organized workforce. However, the state authorities have found ways to defy the contract labour regulations and hire a large majority of the sanitation workforce through contractors. Due to the contractual arrangement, workers are then deprived of all other social security benefits that are available to a regular employee such as paid leave, gratuity, bonus, medical facilities and is systematically Given that the trend of contractualization is likely to continue, it is important to examine the causes behind the expansion of contractual labour and how the trend has impacted wages in formal manufacturing. It is equally important to assess the difference in earned wages between workers and supervisory staff in organized manufacturing to be able to determine the wage divide between different classes of workers. This chapter examines the state of these stigmatized occupations in India and the interventions made by the workers and civil society organizations. The chapter also explores Basu concludes by saying that lower wages provided to such workers with little to no social 10 11
THE STATE OF EMPLOYMENT IN INDIA Overview retirement benefits. One, therefore, encounters sanitation workers and manual scavengers with lower wages. of the remaining workers, who face high levels of employment, health and income insecurity, poverty and vulnerability co-exist, feeding into an eco-system of rising inequality. The NCEUS has shown that socially discriminated groups (SC, ST, Muslim) and women workers are over- represented among the poor and vulnerable. Moreover, women form a distinct group, whose contribution as workers in own account units, and in social reproduction tasks is not recognized and, therefore, they are not considered eligible for social security. discuss the possible ramifications of the direction in which the attempt to expand social security coverage is being made in India, and whether this has potential implications for the widening inequality being witnessed. as migration, state sponsored employment, the larger debate around social protection, specifically on Universal Basic Income or its variant, the Minimum Income Guarantee have been beyond the scope of the present report. These are nonetheless important issues and need to be explored further. Roy and Mukhopadhayay had argued that a number of states have specific regulations about workplace conditions for women which affect the incentive of employers to employ women. These act as employment dampeners. In the case of butchering and leather industry, Mhaskar demonstrates how these conditions are reversed and marginalized communities, women are exploited. In the case of leather industry, the Factories Act, 1948 prohibits women and children from working in these industries. However, employers have been flouting these regulations resulting in an illegal expansion of the leather industry where women belonging to Dalit castes are hired. Given the illegality involved in the hiring, the employees are neither in a position to claim legal protection nor any other benefits under welfare schemes offered by the central, state or local governments. Besides, the wages women receive are consolidated and they do not receive any additional payment for extra work. While the report has covered a lot of ground on the employment debate, crucial areas such especially References Social security is recognized as a human right, in India, as well as internationally. It is also known to play an important redistributive role. This chapter will focus on contingent or protective social security, which covers a narrower set of public measures, which are generally backed by legislative entitlements. Desai, Sonalde. 2019. ‘A strange paradox for Indian women’, The Hindu, 6 March. Available at: https://www. thehindu.com/opinion/op-ed/a-strange-paradox-for-indian-women/article26449536.ece?fbclid=IwAR16v0- XJmw_BqRu8RqMKTQ_eLPxq7i-MPpms5zLA_9DuhRtICUWp_YylYA. Accessed on 7 March 2019. Garg, Lavanya. 2017. ‘65% Indian Women Literate, 5% Have Sole Control Over Choosing Their Husband’, India Spend, 13 February. Available at: https://archive.indiaspend.com/cover-story/65-indian-women-literate-5- have-sole-control-over-choosing-their-husband-71113. Accessed on 7 March 2019. This chapter considers the debates around, and the expansion of social security in India in the current century. Since 2014-15, the Central government has attempted to build an edifice of social security measures which are in the nature of contributory social insurance. Further, the Ministry of Labour and Employment has prepared a Draft Social Security Code. The Code aims to provide a basic minimum universal social security to all workers but has simultaneously proposed far-reaching changes in the delivery system without adequate discussion regarding feasibility and efficiency. Although the second draft proposed in 2018 has modified some of the earlier proposals, the underlying assumption still appears to be that a contributory system can form the core of a social security system for India’s informal workers. Garg, Lavanya and Snigdha Shahi. 2018. ‘Three in Four Indian Women Don’t Work. Can Skilling and Guaranteed Jobs Change That?’, Bloomberg Quint, 12 March. Available at https://www.bloombergquint.com/global- economics/three-in-four-indian-women-dont-work-can-skilling-and-guaranteed-jobs-change-that. Accessed on 7 March 2019. Finally, we end with yet another important dimension of the employment debate—that of social security. Ravi Srivastava in his chapter Inequality and Social Security in India explores why the state has failed to address the inequalities and job insecurities that SC, ST, Muslims, OBCs and women face through its social security and welfare programmes. The Indian economy comprises a small section of workers with social security. Another small percentage of the remaining informal workers are relatively privileged with a high level of income security and the ability to acquire adequate levels of social security through the market. For the bulk While we do not have disaggregated figures for targets achieved in recent years, this chapter will 12 13
THE STATE OF EMPLOYMENT IN INDIA 1. WAGE INEQUALITY & MINIMUM WAGES IN INDIA Widening Gender Wage Gaps BY SAKTI GOLDER 14 15
THE STATE OF EMPLOYMENT IN INDIA 1 Wage Inequality & Minimum Wages in India 1.1 Why do we need to study wage inequality? countries, this bottom 40 percent consists largely of wage earners and therefore, this global call reiterates the importance of wage-led strategy of reducing inequality. In the aftermath of the recent global economic crisis in 2008, there has been a renewed interest in wage policies and policy tools such as minimum wages, which was relatively neglected during the 1980s and 1990s (Papola & Kannan 2017). Presently, these types of policies are equally relevant for India as well, given the extreme level of inequality. The India Wage Report 2018 clearly points out that ‘low pay and wage inequality remain a serious challenge to India’s path to achieving decent working conditions and inclusive growth.’ The national average daily wage in 2011-12 was estimated at INR 247. But, daily wages was more than twice as high in urban areas (INR 384) compared to rural areas (INR 175). Income inequality gets corroborated by the movement of wages. Further, inequalities within various category of workers, reflected in ‘wage inequalities’, often contribute to overall inequality to a significant extent. If there is any increase in the minimum wage level, the workers at the bottom strata benefit and it leads to increase in their wage earnings and may reduce wage inequality. Higher earnings would also lead to increase in the consumption level of the bottom strata and reduce consumption inequalities as well. So, wage inequalities and minimum wages always have a special importance in the discourse on inequality. From this perspective, the issues of wage growth and wage inequality are rightly placed at the centre of the present global development Development Goal (SDG) 8 calls for ‘sustained, inclusive and sustainable economic growth, full and productive employment and decent work for all’, and the global community is committed for that. The goal also highlights the importance of achieving ‘equal pay for work of equal value’. Further, SDG 10 seeks to reduce all forms of inequalities within and among countries, and as the means to achieve that goal it calls to action for income growth of the bottom 40 percent of the population along with other progressive measures. In most of the Average wage paid for casual work was only 36% of the compensation received by regular/salaried workers in 2011-12. In 2011–12, the Gender Pay Gap was 34% in India, that is, women are still getting 34% less compared to their male counterparts. As per the State of Working India Report (SWI 2018 henceforth), in 2015, total 82% of men and 92% of women are earning less than INR 10,000 per month. On this backdrop, it would be worthwhile to mention that when Product (GDP) grows faster than total labour compensation, the share of labour income (also called the ‘wage share’) falls relative to the capital income share (also called the ‘share of profit’) and it ultimately, leads to income inequality.1 In addition to the reduced share of wages in national income, several other factors, namely, wage differences across regions, gender pay gaps, wage differentials between contractual and regular employees, and wage differential across sectors (formal/ informal and agricultural/non- agricultural), social background (caste/religion) are the important factors of wage inequality in India. As wages are the most important factor for the whole section of wage earners and their Gross Domestic On an average, in 2011–12, the wage difference of regular workers (compared to the casual workers) in the organized sector was 3.1 times higher in the primary sector, 2.6 times higher in the tertiary sector and 2.3 times higher in the secondary sector. agenda. Sustainable As per the SWI 2018, even among regular wage workers, more than half (57%) have monthly average earnings of INR 10,000 or less, well under the Seventh Central Pay Commission (CPC) minimum stipulated salary of INR 18,000 per month. SC and ST workers received, on an average, 15% lower wages than other workers in both public and private sectors. The SWI 2018 states that in 2015, the SCs, STs and OBCs earned only 56%, 55% and 72% respectively of upper caste earnings. 1 In the aggregate level, the core driver of economic inequality in an economy is the distribution of the national income between the labour force (wages & salaries) and different forms of surplus (profits, rents and interest etc.). Inequality is not only a concern in terms of national income but also at the personal income level. A higher concentration of wages in the hands of the top earners creates inequality that can affect economic stability. In addition, it can challenge the notion of social justice and undermine social cohesion (ILO, 2012). 16 17
THE STATE OF EMPLOYMENT IN INDIA 1 Wage Inequality & Minimum Wages in India 1.3 Different dimensions and extent of wage inequality families for maintaining a living standard2, increasing real wages3 and moderating wage inequality would ultimately lead to reducing overall inequality in India. Sample million persons aged between 15 to 64 years were employed and the composition of men and women were 290 million (72 percent) and 112 million (28 percent) respectively. This indicates a very low level of work participation rate for women. More than half (51.4 percent, or 206 million people) were self-employed out of the total employed (402 million) in 2011-12. The remaining 195 million of the total employed were wage earners and out of these wage earners, 121 million (62 percent) were employed as casual4 workers. So, only 74 million (38 percent) persons were employed as regular5 employees. Among women workers only 30 percent were in regular/ salaried employment.6 So, it is evident that the larger proportion of wage workers are casual workers. In addition, an overwhelming majority of the workforce is classified as self-employed. Self-employed workers eke out a living either based in their homes or outside, by engaging in activities characterized as ‘Own Account Work’. Papola & Kannan (2017) opines that these types of self-employment is nothing but disguised wage labour engaged in earning activities that are strongly dependent on local markets and domestic consumptions, namely, in petty trading such as street-vending, etc. Therefore, any change in the wages of wage workers will have an impact on the earnings of this group of disguised wage labourers as well. Survey Organization (NSSO), 402 down in the post-reform period (Karan & Sakthivel 2008). Rise in real wages during 2004–05 to 2011–12, was higher than the rise in the previous period. The factors behind this rise in real wages are: (a) agricultural growth along with periodic revision of support prices, (b) the implementation of MGNREGA, which stipulated minimum wages as part of social spending (Jose 2016), and (c) employment dynamics in the construction sector (Chandrasekhar and Ghosh 2015). Given the high levels of segmentation and informality, in both unorganized (formal) and informal labour market, there is multiplicity of wage rates. Further, wages can also differ across industries and even within industries among skilled, semi-skilled and unskilled workers. The wages can also differ on the basis of gender and social identity as well. Across various regions and states, there are also wide variations of wages. Keeping in mind the fact that various forms of inequalities have steadily been increasing (Oxfam 2018) in India over the years, this chapter will analyse the different dimensions of wage inequality. Before going into to the specific issues on wages, it is also important to comprehend the main characteristics and structure of employment in India, which will be discussed in the first section. Section two describes different dimensions of wage inequality and its extent. The third section will discuss on the aggregate level wage inequalities across different deciles and percentiles of workers. The next section discusses some issues around the implementation status of minimum wages in India. On the basis of the discussion, the chapter will attempt to find out some feasible policy options to address the problems. During the period from 1993–94 to 2011–12, the real average daily wages7 has almost doubled and the increase is more prominent in rural areas compared to urban areas. If the entire period of 1993–94 to 2011–12 is taken into account, the average annual growth rate in real wages for all workers was 3.7 percent per year (Table 2.1). It is evident that real wage growth rate increased from 2.6 percent (period 1993–94 to 2004–05) to 5.6 percent per annum (period 2004–05 to 2011–12). So, from 2004–05 to 2011–12, the real wage growth was substantially higher than the previous period. 1.3.1 Overall Wage Trends and Wage Differences Several studies, such as, Karan and Sakthivel (2008) and Sarkar and Mehta (2010) found that wage growth for both regular and casual workers has shown a positive trend at the aggregate level irrespective of rural and urban areas. Additionally, it has been found that wage growth has slowed 1.2 Characteristics and Structure of Employment in India As per the latest Employment Unemployment Survey (EUS) 2011-12 done by the National 2 Further, wages are also important for them for access to the important services like health, education for their children, etc., which further enable them to come out of poverty and in turn contributing in reducing inequality. 3 Real wages show the value of wages adjusted for inflation. So, real wages are the purchasing power of nominal wages. 4 Casual labour: A person who is casually engaged in others’ farm or non-farm enterprises (both household and non-household) and, in return, receives wages according to the terms of the daily or periodic work contract, was considered as casual labour (NSSO 2014: 17). Employment in the organized sector has grown, but even in this sector many jobs have been casual or informal. 5 Regular wage/salaried employee: These are persons who work in others’ farm or non-farm enterprises (both household and non-household) and, in return, receive salary or wages on a regular basis (i.e. not on the basis of daily or periodic renewal of work contract). This category includes not only persons getting time wages but also persons receiving piece wages or salary and paid apprentices, both full-time and part-time. 7 Nominal wages adjusted for changes in consumer prices. 6 All these figures are ILO estimates based on the NSSO data. 18 19
THE STATE OF EMPLOYMENT IN INDIA 1 Wage Inequality & Minimum Wages in India Table 1.3 Average daily wages, by sub-group and gender, 2011-12 (INR in Nominal terms) The national average daily wage in 2011-12 was estimated at INR 247, although there was a substantial gap between rural and urban areas. Despite the higher increase of daily wages in rural areas during 1993-94 to 2011-12, daily wages still remain more than twice as high in urban areas (INR 384) as those in rural areas (INR 175) (Table 1.1). Several others studies, such as, Hnatkovska & Lahiri 2012 and IHD 2014 also found substantial disparities between rural and urban wages although the wage gap is getting narrowed down over the years. This increase could mainly be attributable to the MGNREGA. Due to the relatively higher minimum wages in MGNREGA and most importantly, for gender wage parity in the programme, overall wages of the causal workers has increased during the period from 2004-05 to 2011-12. However, despite the higher percentage increase of wages of casual workers, a large gap still persists. The India Wage Report 2018 (ILO) found that average wage paid for casual work was still only 36 percent of the compensation received by regular/ salaried workers in 2011-12. In the same year, the median wage for regular/salaried of INR 232 was significantly higher compared to the wages of casual workers of INR 120. Male Female Wage Gap Male Female 470 365 105 Urban Workers Regular 324 201 123 Rural Workers 184 112 72 Urban Workers Casual 151 104 47 Rural Workers Source: Estimates based on NSSO data 1.3.2 Wage Trends of Regular and Casual Workers in rural and urban areas. It is evident that large pay gaps in terms of average daily wages still exist and the gap is narrower for regular workers in urban areas. On the other hand, for casual workers, wage gap is narrower in rural areas. age, social group, religion, education, industry, enterprise type, city-size, and state effect. This analysis is based on the 68th round of the NSSO Employment and Unemployment Survey (2011- 12). Further, this is limited to working age (15-59) urban workers and whose sector of employment in the last week is same as their usual principal sector of employment (NIC of principal status is same as NIC of daily status at two digits). There are two takeaways from this analysis. First, irrespective of occupation or enterprise type, a female worker earns less than a male worker (that is, the value is always less than 1). Second, there are variations in the wage differences across various occupations and enterprise type. The wage difference is lesser for more skilled workers and more for semi-skilled or unskilled workers. Across enterprise type, wage difference is less for Government/public sector9 and Public/Private limited company, and more in the Employer’s households10. 1.3.3 Gender Wage Gap Over the years, the wages of casual workers increased more than that of regular workers in India. It is visible from Table 1.2 that during 1993– 94 and 2011–12, daily wages of casual workers has grown by 3.7 percent per annum compared to the regular/salaried workers, whose wages have increased by 3 percent during the same period. However, in absolute terms, during the period from 1993-94 to 2011-12, daily wages of regular workers have increased by INR 165, whereas it has increased by only INR 68 for the casual workers. Gender-based prominent in Indian labour market and the practice is common across various sectors. There are substantial gender gaps across various sectors. Irrespective of employment category (casual and regular/salaried) and location (urban and rural), women workers are paid a lower wage rate (Table 1.3). Table 1.3 shows the male and female wage rates of casual and regular workers discriminations are very Gender pay gaps exist in almost all occupations (see Figure 1.1 & Table 1.4). Figure 1.1 shows the ratio of the average daily wage of an urban female worker to an urban male worker, by different occupations and by different enterprise type. A value of 1 implies that there is no difference in wage rate between a female worker and a male worker. Similarly, any value less than 1 implies that female workers get less than a male worker. This analysis8 is limited to workers who are regular salaried or regular wage employees, which in some sense reflects the organized sector of society. The predicted wage rates are derived from multivariate analysis after controlling for other socio-economic variables including Table 1.2 Real average daily wages and average annual wage growth of regular and casual workers Real daily wages (INR) Base year 2011–12 Compound average annual growth (%) 1993 –94 2004 –05 2011 –12 1993–94 to 2004–05 2004–05 to 2011–12 1993–94 to 2011–12 Regular workers 231 297 396 2.3 4.2 3.0 Casual workers 75 90 143 1.8 6.8 3.7 8 This analysis is done in collaboration with Oxfam’s partner Centre for Policy Research (CPR). 9 The wage difference in the Government/public sector is important to look through the composition of workers by various occupations. While the female workers in these sectors are concentrated more in the education and health profession (51%), the male workers are spread in other sectors including some high paying government/PSU jobs. All workers 128 169 247 2.6 5.6 3.7 Source: Estimates based on NSSO data, India Wage Report 2018, ILO. 10 In the NSSO survey, Employer’s households refers to private households employing maid servant, watchman, cook, etc. 20 21
THE STATE OF EMPLOYMENT IN INDIA 1 Wage Inequality & Minimum Wages in India A similar kind of wage gap across occupations is highlighted by India Wage Report as well. As women professionals in the highest ranks of labour (legislators, senior officials and managers) are aware of their rights (Deshpande & Khanna 2015), the gap is lowest but these constitute only 1 percent of the total female workers (India Wage Report 2018). Women are mostly employed in low skilled occupations. In 2011-12, women workers in low skilled occupations comprise 67 percent of the female workforce (Belser & Rani 2011), female workers receive only 69 per cent of men’s average daily wages. Further, during the period from 1983 to 2011–12, this occupational segregation seems to have intensified (Duraisamy and Duraisamy 2014). As women are engaged mostly in low skilled occupations, they have a lower probability of getting social security benefits compared to men (Srivastava 2016). The above numbers show the ratio of the average predicted wage rate of a female worker to a male worker. The average predicted wage rate is derived from OLS regression after controlling for various socio- economic variables including age, social group, religion, education, industry, city-size and state effect. (A) A: Legislators, senior officials and managers; B: Professionals; C: Technicians and associate professionals; D: Clerks; E: Service workers and shop & market sales workers; F: Skilled agricultural and fishery workers G: Craft and related trades workers; H: Plant and machine operators and assemblers; I: Elementary occupations. (B) 1: Proprietary and partnership; 2: Government/public sector; 3: Public/Private limited company; 4: Co-operative societies/trust/other non-profit institutions; 5: Employer’s households; 6: Others. FIGURE 1.1 Ratio of Average Daily wage of a Female worker to a Male worker (in 2011-12) – Urban Workers Source: Estimated from the NSSO 68th Round Employment and Un-employment Survey (2011-12) (A) OCCUPATION 0.96 1.0 0.87 Table 1.4 Gender Wage Ratio, by Occupation, 1993-94 to 2011-12 0.78 0.8 0.73 Gender Wage Ratio 0.69 0.68 0.67 0.64 0.61 1993-94 2004-05 2011-12 0.6 1 Legislators, senior officials and managers 0.77 0.80 0.92 0.4 2 Professionals 0.84 0.76 0.75 3 Technicians and associate professionals 0.73 0.64 0.62 0.2 4 Clerks 0.97 0.95 0.88 0.0 A B C D E F G H I 5 Service Workers and shop and market sales workers 0.64 0.57 0.52 6 Plant and machine operators and assemblers 0.37 0.41 0.48 (B) ENTERPRISE TYPE 1.0 7 Craft and related trades workers 0.43 0.49 0.53 0.80 0.79 8 Skilled agricultural and fishery workers 0.56 0.54 0.60 0.8 0.68 0.69 0.66 9 Elementary occupation 0.64 0.65 0.69 0.54 0.6 All Occupations 0.52 0.55 0.66 0.4 Source: Estimates based on NSSO data, India Wage Report 2018, ILO. 0.2 0.0 1 2 3 4 5 6 22 23
THE STATE OF EMPLOYMENT IN INDIA 1 Wage Inequality & Minimum Wages in India However, it is a positive sign that the gender wage gap11 has fallen from 48 percent in 1993–94 to 34 percent in 2011–12 but the gap remains high by international standards (ILO 2018). The falling trend of gender wage gap, especially for recent periods, could be attributable to rapid rise in wages partly due to the implementation of MGNREGA. Both employment and minimum wages for all workers are ensured in this right based programme and as a result it pushed up wages in the agricultural sector, getting them slowly closer to the minimum wages specified in MGNREGA (Rani and Belser 2012a, Sudarshan, Bhattacharya and Fernandez Sreedharan and Anoopkumar 2009). It should be noted that there is gender parity in minimum wages fixed in MGNREGA, which contributed to reducing gender wage gaps. Several other studies have also observed that the gender wage gap has generally narrowed over time, across sectors and across industries. primary school teachers. This confirms that women are being employed at very low wages (significantly below legal minimum wages) to implement various government programmes such as the Sarva Shiksha Abhiyan (SSA), National Health Mission (NHM) and Integrated Child Development Scheme (ICDS), etc. For overall decline in the gender wage gap, several factors such as changes in the employment pattern in manufacturing and construction sectors and the larger increase in real wages of women workers could be attributable. (Gulati, Jain and Satija 2013). Further, Jose (2016) argues that the growth of real wages could be attributable to demographic transition and net impact of migration, impact of MGNREGA, and overall effect of social spending in rural areas. MGNREGA played a positive role in increasing rural wages, especially for female workers. There has been a shortage of labour in agricultural work in some places due to MGNREGA and it created an opportunity for workers for demanding better wages in the agricultural sector, thereby, influencing their income (Rani and Belser 2012a). Notwithstanding these trends, wage levels remain lowest in the primary sector, and also remain much lower for casual than for regular workers within the secondary and tertiary sectors. While regular workers’ average wages range from about INR 144 per day in services for private households to INR 852 per day in mining and quarrying, casual workers’ wages rang from INR 122 per day in agriculture to INR 200 per day in hotels and restaurants (India Wage Report 2018). 1.3.4. Wages Across Different Sectors 1.3.4.2 Wages in different sectors of the economy 2010, Nair, 1.3.4.1 Wages in agriculture and non- agricultural casual workers Wage differentials between sectors are important drivers of inter-sectoral movement of workers, away from agriculture and towards non- agricultural sectors. Wage growth has accelerated in all three sectors of the economy—primary, secondary and tertiary12—for both regular and casual wage workers. Wages have increased most rapidly in the primary sector during the period 2004–05 to 2011– 12. Within the secondary sector, there is a strong acceleration of wage growth in mining, manufacturing and construction, while in the tertiary sector, wages have increased substantially in trade, and to a lesser extent in hotels and restaurants, education, and health and social work. By contrast, wage growth slowed down in banking and finance, and in real estate and business services between 2004–05 and 2011–12. It is worth noting that casual workers in some industries of the tertiary sector have had higher increases in wages than regular workers. Rural casual labourers constitute the single largest segment of the country’s workforce and wages are an important part of their income. Table 1.5 shows that since 1993–94, casual workers in agriculture experienced higher wage growth compared to non- agricultural casual workers, the rate rising from 2.2 percent during the period 1993–94 to 2004–05 to 6.6 per cent during the period 2004–05 to 2011–12. 1.3.4.3 Wages in organized and unorganized sectors It is evident from Table 1.6 that during 2004–05 to 2011–12, wage differences for regular workers between organized and unorganized sectors have reduced in the secondary and tertiary sectors. However, the primary sector has witnessed a marginal increase. On an average, in 2011–12, wages of regular workers in the unorganized sector were getting 3.1 times lower than of organized sector workers in the primary sector. For the tertiary sector and secondary sector these ratios are 2.6 and 2.3 respectively. Wages of casual workers in the organized sector reduced in the primary sector compared to other sectors, and the ratios are quite similar across sectors. A recent study (Mondal et al. 2018) has also confirmed that although gender wage gap was not significant for administrators, executives and managers, and professionals, substantial gender wage gap was visible among service workers and domestic workers in 2011-12. Mondal et al. (2018) also found that the gap increased sharply for midwives and health visitors as well as for pre- Due to high demand in the construction sector, many rural workers moved to that sector and it created some scarcity of workers in rural areas and it ultimately led to a rise in agricultural wages Table 1.5 Growth rate of agriculture and non-agricultural casual workers’ wages (%) 19913-94 to 2004-05 2004-05 to 2011-12 1993-94 to 2011-12 Agricultural 2.2 6.6 3.9 Non-Agricultural 1.4 4.9 2.7 12 Economic activities are broadly grouped into primary, secondary, tertiary activities. Primary activities are directly dependent on environment as these refer to utilisation of earth’s resources such as land, water, vegetation, building materials and minerals. It, thus includes, hunting and gathering, pastoral activities, fishing, forestry, agriculture, and mining and quarrying. Secondary activities add value to natural resources by transforming raw materials into valuable products. Secondary activities, therefore, are concerned with manufacturing, processing and construction (infrastructure) industries.Tertiary activities include both production and exchange. The production involves the ‘provision’ of services that are ‘consumed. Exchange, involves trade, transport and communication facilities that are used to overcome distance. Source: ILO estimates based on NSSO Data 11 The difference in average pay between men and women, as a proportion of men’s wages. 24 25
THE STATE OF EMPLOYMENT IN INDIA 1 Wage Inequality & Minimum Wages in India Precisely, remunerations are better in the organized sector, but only for regular workers. All of this demonstrates that a large majority of workers in the Indian labour market still have low wages, and lack job security as well as social protection (IHD 2014, Papola 2008). casual workers. Abraham (2007) indicates that for regular workers, the wage rate of the highest educated (graduates and above) compared to illiterates has been around 3.5 times higher since 1983. Roy (2012) also shows that the ratio of the daily earnings of skilled workers to unskilled workers, which can be taken as the skill premium, declined between 1993–94 and 2009–10. groups, such as scheduled castes (SCs) and scheduled tribes (STs), have been historically marginalized with regard to unequal access to education, employment opportunities, and opportunities to develop skills in certain sectors, thereby widening income inequality. a household in the top 0.2 per cent of income earners in the country.’ 1.3.5 Wages by level of education A number of studies across various countries as well as in India demonstrate that workers with higher levels of education and skills earn higher wages. The general assumption is that wages rise with higher levels of education. This applies more to regular workers, where educational endowments play a more important role in wage determination than for casual workers. In India, those with the highest level of education earn five times more than those with the lowest level of education (Papola and Kannan 2017). This pattern of disparity is prevalent amongst all categories of workers, male, female, rural, urban and regular/salaried workers, except for certain categories of casual workers. Even among regular wage workers, more than half (57 per cent) have monthly average earnings of INR 10,000 or less, well under what the Seventh Central Pay Commission 2013 (implemented with effect from 1 January 2016) stipulated as the minimum salary of INR 18,000 per month. However, if private and public sector employment is taken into consideration, it would be evident that even within regular workers there exists a huge wage gap. The SWI 2018 reports that as per the Labour Bureau Employment–Unemployment nationally, 67 percent of households reported monthly earnings of up to INR 10,000 in 2015. Further, in total, 98 percent earned less than INR 50,000 per month. The report also states that ‘in the age of corporate compensation packages exceeding Rs. 20 lakh a year, it is sobering to learn that earning over Rs. 1 lakh per month puts Wage disparities between workers classified as STs, SCs, Other Backward Classes (OBCs), and Others (forward castes)13 were clearly found in the NSS surveys. Table 1.7 shows sharp differences between wages of regular and casual workers, amongst social groups in urban and rural areas. The difference is more visible in urban areas compared to rural areas. For urban areas in 2011–12, the OBC and SC regular workers were paid between 2 and 2.4 times more than casual workers, for both male and female. For the STs the difference is even higher, ranging from 2.8 to 3.2 times more for male and female workers. One can conclude that access to regular work can really improve wage conditions for these disadvantaged groups, though STs and SCs have a much lower share of regular workers in comparison to their share in the total workforce (IHD 2014). Das and Dutta (2007), based on the NSSO data for 2004– 05, also observed that the chances of securing a regular job was 21.5 percent for higher caste Hindus, while it was only 12.4 percent and 6.7 percent in the case of SCs and STs, respectively. Madeshwaran and Attwell (2007) estimate that SCs and STs workers received, on an average, 15 percent lower wages than other workers in both public and private sectors. They also find occupational discrimination (lack of access to high paying occupations) to be more pronounced than discrimination within a given occupation. They also attribute a major part of the wage gap to differences in human capital endowments. The wage situation among the educated may worsen as there is less job creation from the educated in recent years. As per the latest Labour Bureau data, there is a sharp increase in unemployment rate (UR) among the educated (Mehrotra 2019).The UR rose to 2.4 percent in 2016 from merely 0.6 percent in 2011–12 for those with middle education. UR increased to 3.2 percent (from 1.3 percent) for Class 10 pass, to 4.4 percent (from 2 percent) for Class 12 pass, to 8.4 percent (from 4.1 percent) for graduates and to 8.5 percent (from 5.3 percent) for post- graduates during the same period (Ibid.).The data further shows that for educated youth with technical education, UR rose for graduates from 6.9 percent to 11 percent, for post-grads from 5.7 percent to 7.7 percent and for vocationally trained from 4.9 percent to 7.9 percent. So, it is evident that the unemployment rate among the educated is not only higher compared to the uneducated, it also increases with higher levels of education. So, educated youth are reluctant to enter into the job market (Kwatra 2018), as sufficient regular salaried jobs are not available for them. The lack of quality job creation may further shrink the wage growth among the educated. Survey data, Taking into account average daily wages according to education level, the difference is least among casual workers, as they are often engaged in unskilled work. Among regular workers, there is a wage premium for those with a higher degree of education, while the premium is much less for Table 1.6 Wage ratios between organized and unorganized workers, by economic sectors 2004–05 2011–12 3.0 3.1 Regular workers Primary Sector 1.8 0.9 Casual workers 2.5 2.3 Regular workers Secondary Sector 1.3.6 Wages by social background 0.9 0.8 Casual workers Social institutions such as caste also segregate the Indian labour market. Some disadvantaged 2.8 2.6 Regular workers Tertiary Sector 1.1 0.9 Casual workers Source: Estimates based on the NSSO data 13 It consists of forward castes and other castes which are not classified elsewhere. 26 27
THE STATE OF EMPLOYMENT IN INDIA 1 Wage Inequality & Minimum Wages in India Table 1.7 Real average daily urban wages by type of worker, 2004–05 and 2011–12 (INR, base year 2011–12) A recent report, the SWI 2018 has also highlighted some glaring facts about caste-based wage gap. The report states that caste-based earnings gap is larger than the gender earnings gap. In 2015, the SCs, STs and OBCs earn only 56 percent, 55 percent and 72 percent respectively of upper caste earnings. A measurement used to address inequality and highlight the differences in wage distribution is the ratio of the two extremes – the highest and lowest wages. For instance, the ILO Global Wage Report (ILO, 2016b) has used this indicator to compare low- and high-wage earners (P90/P10)14, as well as comparing middle-wage earners (P50/P10). 2004-05 2011-12 Regular Casual Regular Casual Urban male others 420 133 579 173 Urban male OBC 288 138 383 193 The ILO Wage Report found that there was a clear reduction in inequality between the top and bottom wage earners, as the P90/P10 inter- quantile indicator has decreased from 8.6 in 1993–94 to 6.7 in 2011–12, although in 2004–05 there was a slight increase (9.0). The ratio has been decreasing continuously from 2.4 in 1993–94 to 1.9 in 2011–12 for bottom and middle wage earners, which implies that inequality was reduced. The reduction in inequality can be explained due to the higher wage increase registered by casual workers, who correspond to the bottom part of wage distribution in the Indian economy. It is coming out from the discussion above that there are several factors that can influence wage rates and may lead to wage inequality and it is prevailing across various sectors in the Indian labour market. In fact, wage disparities originating from factors such as the level of education of workers, skill level, status of employment (regular/ casual) etc. cannot be removed completely; rather it could be moderated and socially acceptable bounds could be achieved. However, from the normative perspective, wage discrimination on the basis of gender, castes, etc.must be abolished completely. Urban male SC 262 127 362 180 Urban male ST 369 112 445 160 Urban female others 348 83 504 104 Urban female OBC 194 76 276 115 Urban female SC 165 78 225 116 Urban female ST 220 77 340 105 Source:: ILO estimates based on NSSO data 1.4 Wage inequality in Aggregate Level Table 1.8 Real average daily rural wages by type of worker, 2004–05 and 2011–12 (INR, base year 2011–12) It is evident that inequality in wage distribution for the lower half has declined substantially. Furthermore, there is scope for closing the gap between the lowest and the middle wage groups through adequate enforcement of minimum wages (Belser and Rani 2011). In fact, empirical evidence suggests that the assurance of a minimum income at the bottom of the pay scale can help reduce poverty and also counter inequality (Belser and Rani 2015). There is also empirical evidence which suggests that minimum wages have a positive impact on wages at the lower end of distribution and can also increase along the higher cohorts of wage distribution (Rani and Ranjbar 2015). 2004-05 2011-12 Many studies have documented an increase in overall wage inequality in India, particularly between 1993–94 and 2004–05. Nevertheless, there is no uniform wage inequality for all workers, and it can differ for different types of employment. On the one hand, wage inequality among casual workers, both in rural and urban areas, has consistently decreased between 1983 and 2004–05 (Abraham 2007, Sarkar and Mehta, 2010). On the other hand, wage inequality among regular workers, both in rural and urban areas, has increased between 1983 and 2004–05 (Dutta 2005, Sarkar and Mehta 2010). Regular Casual Regular Casual Rural male others 330 103 375 152 Rural male OBC 234 107 297 158 Rural male SC 221 100 284 150 Rural male ST 238 83 337 122 Rural female others 209 64 251 100 Rural female OBC 142 63 194 105 Rural female SC 109 65 148 106 Rural female ST 144 60 197 97 Source:: ILO estimates based on NSSO data 14 Disparities in wages can be measured using percentile ratios (P90/P10). P10 is the maximum wage received by the 10 per cent of employees earning the least. P90 is the minimum wage received by the 10 per cent of employees earning the most. 28 29
THE STATE OF EMPLOYMENT IN INDIA 1 Wage Inequality & Minimum Wages in India Table 1.9 Violation OF Minimum Wages in the MGNREGA It should be noted that different dimensions and factors of wage inequality has already been discussed in the previous sections. Further, it is also important to note that in 2015, total 82 percent of men and 92 percent of women were earning less than Rs 10,000 per month.This was far lower, compared to the lowest salary (Rs 18,000 per month) recommended by the Seventh Central Pay Commission (2013). So, for increasing the income of this vast section of wage earners, focus should be on wage policies. The effectiveness of these policies is already documented in several studies mentioned above. On this backdrop, it would be worthwhile to have a closer scrutiny of the implementation of minimum wages in India. Employment Report 2014 estimated (based on NSSO 2009-10 data) that 73 percent of rural farm, 37 percent of rural non-farm and 54 percent of urban non-farm causal workers received wages below the statutorily fixed minimum wages. The proportion of women was much higher compared to the male. It is already mentioned above, how women workers are denied the minimum wages even for implementing the government programmes in health, education and other sectors. Average Wage Rate paid per day per person (INR)[in 2017-18] Notified Minimum Wage Rate (INR) [in 2017-18] Gap = (Notified Minimum Wage - Average Wage) Andhra Pradesh 152 197 45 Arunachal Pradesh 177 177 0 Assam 183 183 0 Bihar 177 168 -9 Chhattisgarh 166 172 6 Gujarat 177 192 15 Haryana 278 277 -1 Violation of minimum wages is visible in the largest employment generating programme, that is, in MGNREGA. It is evident from Table 1.9, that workers are denied the statutory minimum wages in several states and UTs. In some states and UTs, the deviations are stark. Jammu and Kashmir 179 179 0 Jharkhand 168 168 0 Karnataka 236 236 0 1.5 Implementation of Minimum Wages in India Kerala 261 258 -3 Madhya Pradesh 165 172 7 Maharashtra 189 201 12 Violation of minimum wages is also visible in top level companies as well. As per the Oxfam India Study (Making Inclusive Growth 2018), in 2017, out of top 99 companies in India only 24 companies have explicitly stated their commitment to ensuring minimum wages and only 6 companies have actually committed to providing fair living wages.15 Manipur 204 204 0 Adopting the Minimum Wages Act in 1948, which is considered to be one of the important pieces of legislation, India became one of the first developing countries to introduce minimum wage policies. In the later period, several other Acts related to wage policies were also adopted. However, the diverse socio-economic situations across states made the minimum wage system a complex one, and it ultimately led to a large number of minimum wage rates, which makes it difficult to implement and monitor. Say for instance, at present, total 1709 rates are existing in India (India Wage Report 2018). Due to the existence of a huge informal sector, the implementation, and monitoring the implementation of these minimum wages is also a daunting task. This leads to rampant violation of the minimum wages. The India Labour and Meghalaya 175 175 0 Mizoram 194 194 0 Nagaland 177 177 0 Odisha 174 176 2 Punjab 227 233 6 Rajasthan 137 192 55 Sikkim 179 177 -2 Tamil Nadu 152 205 53 Tripura 169 177 8 Uttar Pradesh 175 175 0 Uttarakhand 175 175 0 West Bengal 171 180 9 Goa 240 240 0 Lakshadweep 237 237 0 Puducherry 180 205 25 Chandigarh 183 265 82 Telangana 140 197 57 Source: ILO estimates based on NSSO Data 15 A living wage is the minimum income necessary for a worker to meet their basic needs. 30 31
THE STATE OF EMPLOYMENT IN INDIA 1 Wage Inequality & Minimum Wages in India 1.6 Addressing Wage Inequality the national floor level minimum wage across the country. ∙ For extending the coverage of minimum wages, the government can focus on expanding public employment generation programmes and adhering to minimum wages in these programmes. ∙ Ensuring full consultation far as possible, the direct participation of social partners18 on a basis of equality in the establishment and operation of minimum wage systems. ∙ Undertaking more regular and evidence-based adjustments in the minimum wages. ∙ Progressively consolidating and simplifying minimum wage structures to make it easier to implement. ∙ Taking stronger measures to ensure a more effective application of minimum wage law. between government and social partners can play an important role in creating the conditions for effective collective bargaining – at all levels – by ensuring that the appropriate framework is in place. evaluation methods free from gender bias. 1.7 Moving forward Labour market institutions and wage policies can play an effective role in reducing inequality by protecting the interests of working groups that are vulnerable, disadvantaged or subject to discrimination. Globally, there is growing recognition that wage trends must be monitored properly. Implementing sustainable wage policies could prevent wage stagnation. It would ras a result raise the levels of pay for millions of working poor around the world, ensure fair distribution, reduce excessive wage and income inequalities, and buttress consumption. Presently, in India there exist huge wage inequalities across all sectors, between male and female and also among social groups. By ensuring a certain level of minimum wages across all sectors and its periodic upward revisions, wage inequality could be moderated and arrived at socially acceptable bounds. This could be complemented by expanding public employment generationand various other social protection schemes. Sustainable wage policies is a widely shared objective across countries nowadays for ensuring decent work and inclusive growth. To achieve these objectives, international bodies such as ILO advocate for adequate living wages for all. On similar lines, G20 has also adopted a call for sustainable wage policy principles, specifically minimum wages16 and collective bargaining, which ensures that wages grow in tandem with labour productivity. These would contribute to reducing inequality and promote inclusive growth. To address gender wage gaps is also a central objective in G20 wages policies. On the backdrop of these global agenda and most importantly considering various dimensions of wage inequality in India, proper policy interventions are required in the following areas. To be more inclusive, the organizational basis for collective labour relations could be strengthened, drawing on new networks and sources of power, including those in the unorganized or informal sector. The Mahatma Gandhi National Rural Employment Guarantee Act (MGNREGA) and the Street Vendors (Protection of Livelihood and Regulation of Street Vending) Act 2014 are important initiatives to bring informal sector workers into the realm of legislations. Other efforts could be undertaken to bring the informal economy within the country’s legislative framework and into the framework of social dialogue and collective bargaining. and, in so 1.6.2 Collective bargaining 1.6.3 Promoting equal pay for work of equal value Collective bargaining19 offers a mechanism for inclusive, coordinated wage setting. Collective agreements on wages can be used to establish minimum standards as well as to set wages above an existing wage floor. It is recommended that the government strengthen the framework for collective bargaining. Tripartite cooperation 1.6.1 Ensuring Minimum wages There are several possible options to improve the current minimum wage system in India. The policies17 that India can adopt are: A significant source of wage inequality can be found in exclusion or discrimination against some categories of workers, including women and scheduled castes. To reduce wage gaps, national legislation must provide for the right to equal remuneration for work of equal value and effective access to justice to claim this right. Overcoming unequal pay across groups requires sustained effort at various levels and through a wide range of policy approaches. Equal pay for men and women needs to be promoted through strong policies, including raising awareness, combating gender-based stereotypes about women’s roles and aspirations, strengthening polices on maternity leave, and advocacy for better sharing of family responsibilities. Equal pay at the enterprise level also requires job ∙ Extending legal coverage to all workers in an employment relationship and implementing 16 Although India had not ratified ILO Convention No. 131 –The Minimum Wage Fixing Convention, India’s Minimum Wage Act 1948 is mostly similar to the Convention No. 131. Even India’s Minimum Wage Act 1948 is considered as one of the most comprehensive piece of legislation. 17 In line with conclusions of a capacity-building workshop titled “Towards more effective wage policies in India”, jointly organized by V.V. Giri National Labour Institute and the ILO, New Delhi in April 2015, 18 Social partner refers an individual or organization, such as an employer, trade union, or employee, participating in a cooperative relationship for the mutual benefit of all concerned. 19 It is important to understand how minimum wages and collective bargaining interact. In most countries where a statutory minimum wage exists, minimum wages provide a wage floor for the lowest paid, and collective bargaining can determine higher wage floors or lift wages for those above the minimum. The relationship between statutory minimum wage policies and collective bargaining is thus of particular importance. Minimum wages should not be used as a substitute for collective bargaining. 32 33
THE STATE OF EMPLOYMENT IN INDIA 1 Wage Inequality & Minimum Wages in India References Madheswaran, S. and P. Attewell. 2007. ‘Caste discrimination in the Indian urban labour market: Evidence from the National Sample Survey’. Economic and Political Weekly. Vol. 42, No. 41, pp. 4146–4153. Abraham, V. 2007. ‘Growth and inequality of wages in India: Recent trends and patterns’, in Indian Journal of Labour Economics, Vol. 50, No. 4, pp. 927–941. Belser, P. and U. Rani. 2015. ‘Minimum wages and inequality’. In J. Berg (ed.) Labour markets, institutions and inequality: Building just societies in the 21st century. Geneva: ILO, pp. 123–146. Merhotra, S. 2019. ‘India Does Have a Real Employment Crisis/; And it’s Worsening’, The Wire. Retrieved from https://thewire.in/economy/india-worsening-employment-crisis. Accessed on February 6. Mondal, B., J. Ghosh, S. Chakraborty and S. Mitra. 2018, Women Workers in India, CSE Working Paper, Azim Premji University. —— 2011. ‘Extending the coverage of minimum wages in India: Simulations from household data’. Economic and Political Weekly. Vol. 46, No. 22, pp. 47–55. Nair, K.N., T.P. Sreedharan, M. Anoopkumar. 2009. ‘A study of National Rural Employment Guarantee Programme in three Grama Panchayats of Kasargod district’. Working Paper No. 413. Trivandrum: Centre for Development Studies. Chandrasekhar, C.P. and J. Ghosh. 2015. Growth, employment patterns and inequality in Asia: A case study of India. ILO Asia-Pacific Working Paper Series. Bangkok: ILO. India Inequality Report. 2018. Widening Gaps. New Delhi: Oxfam India. Das, M.B. and P. Dutta. 2007. ‘Does caste matter for wages in the Indian labour market?’ Working Paper, Washington, DC: Social and Human Development Unit, World Bank. Papola, T. S. and K.P. Kannan. 2017. Towards an India wage report, ILO Asia-Pacific Working Paper Series. New Delhi: ILO. Deshpande, A., D. Goel and S. Khanna. 2015. ‘Bad karma or discrimination? Male female wage gaps among salaried workers in India’, IZA Discussion Paper No. 9485. Bonn: Institute for the Study of Labor. Rani, U. and P. Belser, 2012a. ‘The effectiveness of minimum wages in developing countries: The case of India’, International Journal of Labour Research, Vol. 4, No. 1, pp. 45–66. Duraisamy, M. and P. Duraisamy. 2014. Occupational segregation, wage and job discrimination against women across social groups in the Indian labor market: 1983–2010, Preliminary draft, Chennai: Madras Institute of Development Studies. Rani, U. and S. Ranjbar. 2015. Impact of minimum wages on wage quantiles: Evidence from developing countries. Geneva: ILO. Roy, S. 2012. ‘Skill premium: What caused the mismatch?’. MPRA Paper No./18010. Munich: Munich University Library. Dutta, P.V. 2005. ‘Accounting for wage inequality in India’. The Indian Journal of Labour Economics. Vol. 48, No. 2, pp. 273–295. Sarkar, S. and B.S. Mehta. 2010. ‘Income inequality in India: Pre- and post-reform periods’. Economic and Political Weekly. Vol. 45, No. 37, pp. 45–55. Gulati, A., S. Jain and N. Satija. 2013. Rising farm wages in India: The ‘pull’ and ‘push’ factors. New Delhi: Ministry of Agriculture, CAC P, GOI. Srivastava, R. 2016. Structural change and non-standard forms of employment in India. Geneva: ILO, Working Conditions Branch. Hnatkovska, V. and Lahiri, A. 2012. ‘Structural transformation and the rural-urban divide’, Working Paper. Vancouver: Department of Economics, University of British Columbia. State of Working India 2018. Report, Centre for Sustainable Employment, Azim Premji University. India Wage Report, 2018, International Labour Organisation (ILO). Sudarshan, R.M., R. Bhattacharya, G. Fernandez. 2010. ‘Women’s participation in the NREGS: Some observations from fieldwork in Himachal Pradesh, Kerala and Rajasthan’. IDS Bulletin, Vol. 41, No. 4, pp. 77–81.. Institute for Human Development (IHD). 2014. India Labour and Employment Report 2014: Workers in the era of globalization. New Delhi: IHD and Academic Publishers. Jose, A.V. 2016. ‘Real wages in rural India’. In K.P Kannan, R.P. Mamgain and P. Rustagi (eds) Labour and development: Essays in honour of Prof. T.S. Papola. New Delhi: Academic Foundation. Karan, A.K. and S. Sakthivel. 2008. Trends in wages and earnings in India: Increasing wage differentials in a segmented labour market. New Delhi: ILO Sub-regional Office for South Asia. I would like to thank Partha Mukhopadhyay, Kanhu Charan Pradhan and Shamindra Nath Roy for their inputs on gender wage gap analysis, Jayati Ghosh and Sandip Sarkar for commenting on the earlier draft of this paper, Diya Dutta and Ranu Kayastha Bhogal for commenting on the draft and also careful editing. All errors are mine. Kwatra, N. 2018. ‘Young India not so hopeful about job prospects’. Retrieved from https://www.livemint.com/ Industry/gw0jCKRG6dWpa4WkmYOQBN/Young-India-not-so-hopeful-about-job-prospects.html. Accessed on Feb 14, 2019. 34 35
THE STATE OF EMPLOYMENT IN INDIA 1 Wage Inequality & Minimum Wages in India Not Getting Their Dues By Savvy Soumya Misra On December 10, 2018, the Delhi government launched a 10-day drive, Operation Minimum Wages, and a helpline number (155124) for people to register their complaints (IANS 2018). This was done to ensure that minimum wages were paid to all workers in the national capital. In the raids on day one, the Delhi government found violations of the Minimum Wages Act in at least 20 establishments including hospitals, schools, private firms, offices in Mangolpuri in northwest district of Delhi. The raids conducted by teams from the labour department found violations regarding minimum wages and medical benefits (Times News Network 2018). While the smaller manufacturing units pass the buck to demonetization, Goods & Services Tax (GST) and National Green Tribunal — the last calling for closure of the polluting units in the residential areas — the larger factories such as garment export units defy rules unabashedly. In Gurgaon’s garment hub, almost all women workers in these units are daily wages workers / casual workers (they fall in the unskilled category) and should get INR 318.40 per day for 9 hours of work, but instead they are made to work for more than 10 hours and barely get between INR 250 - INR 280. minimum wages are a distant dream. They get anything between INR 6000 to INR 10,000. Those who work in the more strenuous polishing work are paid on a piece rate basis, and can earn upto INR 400 a day that is upto INR 10,000 a month. The labourers involved in chak-mitti (in which excess polish is dust off the vessel) get monthly wages of about INR 7500, which is nearly half of what the Delhi government has set (Ibid.). ‘I get Rs 7000. We do get weekly offs. But there are no sick leaves. If we do take a leave then our wages get deducted,’ says Rajan, who lives in Mukundpur and works in Wazirpur. He works at the steel circle cutting unit and involved in chak-mitti. and government According to the 2018 Global Gender Gap Report, published by the World Economic Forum, India ranks 72 among 149 nations on the ‘wage equality for similar work’ parameter. And these gaps are evident in urban as well as the rural sector. In the services sector too, elements of Minimum Wages Act are defied. A security guard, associated with a security agency in the national capital, said that while he got INR 14000 a month and has the PF and ESI component in his wages, he is made to work for 30 or 31 days and for 12 hours a day. According to Minimum Wages Act, wages should be fixed for 26 days and eight hours a day. ‘The security agency makes us sign a document that states that we work for 26 days and 8 hours, get weekly offs as well as other gazette holidays. But the fact of the matter is that for the last one year that I have worked, I have not got a single off. If somebody has to take a sick leave, wages are deducted accordingly,’ says the security guard on the condition of anonymity. These units do not have Provident Funds (on account of the fact that they show they are one shy of 20 people) or Employee State Insurance (ESI). The latter is health coverage for both the employee and their dependent. The polishing unit is one of the most polluting and hazardous jobs within the steel production process in Wazirpur. Workers are vulnerable to the polish dust, which slowly settles in their lungs, and also the heavy motor that is used to polish vessels, which invariably injures their hands and feet (Mohana 2015). Yet there are no medical benefits for workers. While the Delhi government conducted raids and booked violators, the fact of the matter remains that minimum wage rules continue to be flouted. The other issues are the lack of social benefits and there are gender and caste disparities too. Reverting to the garment factories, wage inequality is inherently built into the hiring structure. Men are hired for more supervisory roles, hence the better pay. Women, on the other hand, are tailors, trimmers and cutters. There are a few men who work as tailors, cutters and trimmers, just like the women, but they are paid higher wages. For instance, in Bangalore a tailoring job would see a wage difference of INR 300 - 500 between men and women. Not far from Mangolpuri is the Wazirpur Industrial Area with its steel pickling units. According to the latest amendment in Delhi’s minimum wage rates, unskilled labourer should get INR 14,000 per month that is, INR 538 per day (revised). It was INR 13350 per month (before the revision) (Delhi Government, Labour Department. 2018). But for those at these steel pickling units, Among agriculture workers, in Bihar’s Bhojpur, for instance, women get INR 100 for a day’s work while men get upto INR 250. The argument can be that 36 37
THE STATE OF EMPLOYMENT IN INDIA 1 Wage Inequality & Minimum Wages in India men are involved in more strenuous work and are able to do more in the given time. But even in the same kind of work they are paid more. There are caste dynamics too; women who belong to castes considered marginally better than the Mahadalit, or even within mahadalit, will be paid a tad more. But for women, all factors considered, the wages are still lower than the states minimum wage rate. Though the gender wage gaps are high by international standards, it is decreasing; gender wage gap has fallen from 48 percent in 1993–94 to 34 percent in 2011–12. The falling trend of gender wage gap could be attributable to rapid rise in wages partly due to the implementation of MGNREGA. MGNREGA has regional disparities — Haryana with the highest rate of INR 281 per day and Bihar and Jharkhand with the lowest wages of INR 168 (for the year 2018-19) — and they are often lower than the minimum wages of the state. force participation; Opportunities as legislators, senior level, and managers; Opportunities as professional and technical workers — all in which India ranks poorly in the 2018 Global Gender Gap Report. Strict and regular enforcement of the Minimum Wages Act has to be ensured. Unless proper implementation is ensured no amount of streamlining the different labour acts into a Code on Wages, 2017 and setting a national minimum wage is going to make much of a difference. References Aggarwal, Ankita. 2017. ‘Fairness of Minimum Wages for MGNREGA’. Economic and Political Weekly. Vol LII No 44. Available at https://www.epw.in/system/files/pdf/2017_52/44/CM_LII_44_041117_ Ankita_Aggarwal.pdf. Accessed on December 19, 2018. Delhi Government, Labour Department. 2018. ‘Current Minimum Wages Consequent upon Hon’ble Supreme Court order dated 31 October 2018 applicable rates of Minimum Wages w.e.f. 01 November 2018 (including D.A. w.e.f. 01 April 2017, 01 April 2018 and 01 October 2018)’. Available at http:// www.delhi.gov.in/wps/wcm/connect/doit_labour/Labour/Home/Minimum+Wages/. Accessed on December 19, 2018. IANS. 2018. ‘Delhi Launches Special Drive To Enforce Minimum Wage Rules’, December 5. Available at https://www.ndtv.com/delhi-news/delhi-launches-special-drive-to-enforce-minimum-wagerules- 1957879. Accessed on December 19, 2018. Krishnan, Swati Mohana. 2015. ‘Identity and the “Politics of Patronage”: A Case Study of Steel Polish Enterprise Owners in Wazirpur Industrial area’, Dissertation presented in Partial Fulfillment of the Requirements for the Degree Master of Arts in the School of Development Studies. New Delhi: Ambedkar University. In its initial years, workers under MGNREGA were paid as per section 6 (2) of the MGNREGA, which stated that minimum wages set for agricultural labourers by the state would be the MGNREGA wage rate applicable for that area. However, in January 2009, the central government kicked in section 6 (1) and delinked MGNREGA from the Minimum Wages Act. This left the MGNREGA wages, lurking way below the minimum wages for agricultural labour set by the states (Agarwal 2017). Times News Network. 2018. ‘Delhi: Raids find 20 employers not paying minimum wages’, December 11. Available at https://timesofindia.indiatimes.com/city/delhi/raids-find-20- employers-not-paying-min-wages/articleshow/67032277.cms. Accessed on December 19, 2018. Keeping aside the ongoing deliberation for the MGNREGA wages and the present government’s reservation for this rural employment guarantee Act, it still has the positive aspect of treating men and women equally. But more needs to be done to bridge the wage inequality — Increased labour 38 39
THE STATE OF EMPLOYMENT IN INDIA 2. Inequality and Rural Employment Agrarian Distress and Dalit Women BY Ishita Mehrotra 40 41
THE STATE OF EMPLOYMENT IN INDIA 2 Inequality and Rural Employment 2.1 Linking Inequality, Employment and Labour Markets With this understanding of the relationship between growth and poverty and the policy discourse emanating thereof, how has India fared? At the end of the first two decades of this millennium, what we see in our country is that despite high growth rates, jobs remain a huge challenge for India. This has to be understood with reference to the lopsided nature of Indian growth. The services sector accounts for more than half of India’s GDP, but does not make a significant contribution in employment generation (Chandrasekhar and Ghosh 2018). While the share of agriculture in GDP has fallen over the years to about 14 percent presently, almost half the workforce (about 49 percent) still directly or indirectly depends on agriculture for livelihoods (Rustagi 2015). Moreover, according to a NCEUS report (2008), in the early 2000s when India reported about 8 percent growth rate per annum, 77 percent of the population was poor and vulnerable (Sengupta, Kannan and Raveendran 2008). In fact, according to an ILO report (2016), overall rural employment grew at an average of less than 1 percent per annum in the periods 1999-2000 and 2011-12. Simply put, India is recording high growth but at the same time, large sections of its citizenry are struggling to survive on the margins. That capital is accumulating more and more and that the share of labour is falling is a reality across countries (Oxfam International 2016, 2017). Agriculture as the main source of rural employment has been on the decline since the 1990s. Analysis of NSS data by Usami and Rawal (2018) shows that share of total employment in agriculture fell sharply from 73.7% in 1993-94 to 59.4% in 2011-12. Since rural women labourers are disproportionately concentrated in agriculture, they are also the worst hit by the contraction of employment opportunities in agriculture. Accessing stable, productive and well-paying jobs through the labour market is an important avenue out of poverty. Towards the end of the twentieth century, evidence from many developing countries had debunked the assumption that economic growth would automatically lead to a decline in inequality and poverty. Against this background, the first two decades of the twenty-first century saw mainstream development emphasizing first on pro-poor growth and then on the idea of inclusive growth. In line with one understanding of pro-poor growth, inclusive growth too emphasized on the importance of market-driven growth for poverty reduction, with the government playing an enabling role by removing obstacles to growth, for example, by deregulating the labour market (For a detailed discussion on economic policy, see Saad-Filho 2010).The so called inclusive growth paradigm did not consider that inequality itself might have a structural relationship to the growth process or that such growth may actually fuel poverty. Rather, inclusiveness was narrowly understood as being ‘concerned with opportunities for the majority of the labor force, poor and middle-class alike’...‘in terms of access to markets, resources, and unbiased regulatory environment for businesses and individuals’ (World Bank 2009: 1 and 2). In sum, the growth process would be left untouched, with reliance on social safety nets, that is, in-kind or fiscal transfer mechanisms to alleviate the ill effects of growth. Since the 1990s, there has been increasing diversification away from agriculture. This has been more the case for men than for women. According to NSS data, in 1993-94, 75% of men and 86% of women were engaged in primary sector activities (including agriculture and other sectors such as mining) which reduced to 59% for men and 75% for women workers in 2011-12 (Mitra 2018). For a variety of reasons, women engage in only certain types of rural non-farm employment– most commonly in manufacturing and construction (this showed a huge increase partly due to pubic interventions such as MGNREGA). Manufacturing accounted for 9.8% of total rural non-farm workers in 2011-12 and construction accounted for 6.6% in 2011-12 (ibid). thinking Social identity and roles, such as caste and gender, continue to be important determinants of occupational profiles. According to the NSS 68th Round, in rural India, households reporting casual labour as the major income source was the highest for Dalit (52.6%) and Adivasi (38.3%) households. The percentage of rural women in casual labour is 35.1%; Dalit women constituted 50.6% in this and ST women 39.3%. Land ownership is linked to political and economic power. Land is a major indicator of asset inequality in rural India. The share of land owned in rural India by different social groups was 13.06% for STs, 9.23% for SCs, 45.68% for OBCs and 32.03% for others (NSSO 2013). In livestock and farm equipment, the share of SCs is 11.7%, 43.8% for OBCs, 25.5% for High Castes and 18.9% for Rest (Thorat and Madheswaran 2018). Figures provide one side of the story. In a country like India which is characterized by deep inequalities, labour markets cannot be understood solely in an economic sense with reference to percentage of employment created, poverty effects, extent of unemployment or underemployment, wage rates, etc. Labour 42 43
THE STATE OF EMPLOYMENT IN INDIA 2 Inequality and Rural Employment markets, especially rural labour markets, are arenas of social relations where unequal power relations are a norm. Labour relations are based on a political economy of difference – of caste, gender, religion, region, asset base, capabilities, etc. These factors influence who can access what type of jobs, under what terms and conditions and with what labour market outcomes. Discrimination actually starts before one even enters the labour market. farmers and agricultural labourers.2 Ghosh (2015) and Ramachandran et al. (2010) have highlighted that reduced government spending on rural credit, on irrigation and on rural industries, government driven employment schemes and privatization of health and education has resulted in a high incidence of indebtedness. This has led to reverse tenancy, decreased investment in farm, reduced food intake, outmigration in general and has put a further squeeze on rural employment opportunities. The burden of the crisis is borne by three groups in particular, Dalits, Adivasis and women. These groups are hit worse also because of historical reasons. For instance, as put by Thorat, ‘the limited access to agricultural land and capital assets is both due to the historical legacy associated with restrictions imposed by the caste system and the ongoing discrimination in land market and capital market and other related economic spheres’ (cited in Bakshi 2008: 2). India’s working poor (just under 60 percent taking USD2 as poverty line) are characterized by structural inequalities, degrees of informality, low wages, little or no social protection, very low levels of education, skills and health standards (Institute for Human Development 2014). There is a strong correlation between poverty and social identity. India’s poor are also more likely to be Dalits, Adivasis, Muslims and then OBCs (Kannan 2018). Clearly then, India’s growth has been unequal and based on exclusions. Based on detailed fieldwork from different regions of India, Shah et al. (2018) have documented that capitalist modernity and accumulation is in fact premised on inherited social identities. revision of land ceilings, trade liberalization with regard to agricultural commodities and increasing dominance of MNCs in input markets (For a detailed discussion on the main features of agrarian neoliberalism, in general, see Bernstein [2010] and for India specifically, see, Chandrasekhar and Ghosh [2002]; Ghosh [2005]; Reddy and Mishra [2009]; Ramachandran and Rawal [2010] and Chandrasekhar [2017]). While India’s regional diversity precludes a uniform picture, the unpacking of agrarian neoliberal agenda, together with other historical changes relating to technological developments, changes in cultivation practices, fragmentation of landholdings with successive generations, etc. have culminated in a situation of rural distress and agrarian crisis with its class, caste and gender specificities. Small and marginal farmers (about 80 percent) and agricultural labourers are most affected by the agrarian crisis, majority of them are Dalits or Adivasis and unlike men, women labourers continue to be concentrated in agriculture due to socio-cultural restrictions and lack of appropriate alternate employment opportunities in villages (NCEUS 2007, 2008; Mehrotra 2013, 2017). Utsa Patnaik’s (2003) work shows that neoliberal fetishism is directly responsible for increased poverty, unemployment and food insecurity in India. Farmers’ suicides are an extreme manifestation of this crisis.1 To enable domestic and foreign capital (whether agri-business or otherwise) to acquire land, states arerevising existing land laws or devising ever interesting new techniques such as land pooling or creating SEZs. The result is greater accumulation for industrialists, for real estate barons and greater dispossession of land and livelihoods for the In the following section, the discussion moves to how rural India, in general and the rural labouring classes, in particular, have fared under more than two decades of India’s pursuit of neoliberal capitalist globalization. It is against this background that one has to understand what is happening with rural employment. Two things need to be noted, though. One, not all agrarian classes are faced with a crisis situation. Detailed field based studies such as that of Das Gupta (2019) show that there are capitalist farmers who successfully straddle rural and urban India, have diversified into agricultural trade and business. A part of politically and socially dominant classes, these capitalist farmers also operate as agents of transnational agrarian capital, pocketing super profits. Second, the UPA period did see some positive measures for farmers – greater investment in agricultural credit and rural infrastructure in general. The rights based agenda of development of UPA also gave a boost to agriculture. For example, MGNREGA ensured a basic minimum income to the poorest and also led to the creation of 2.2 Rural Distress and Agrarian Crisis Changed contours of agricultural development under neoliberal capitalist globalization has had tremendous consequences for the rural labouring classes. This is important to understand because, though subject to much debate, rural labour continues to be either perceived as predominantly agrarian or at least originating from the village agricultural economy. Agrarian neoliberalism included, among other things, reduction of government expenditure on rural infrastructure (credit, power, irrigation, subsidies on seeds and fertilizers, extension and support services), limiting the scope of PDS, 1 The politics of how farmers and suicides are defined is another story. On this, see, Sainath (2015). 2 For detailed case studies, see for example, Sud (2009), Levien (2012) and Sampat (2016). 44 45
THE STATE OF EMPLOYMENT IN INDIA 2 Inequality and Rural Employment infrastructure such as storage, roads, irrigation channels and canals, etc. The FRA ensured continued access of Adivasis to traditional forest resources, crucial to their livelihood. According to Ghosh, increased investment in agriculture during the UPA period saw an increase in the production of foodgrains and non-food crops and capital formation in agriculture also increased. Investment in agriculture started decelerating towards the end of the UPA period. The present NDA government has not delivered on its promises of high MSP, affordable and good quality rural health services, etc. In fact, soon after being voted into power, the Modi government sought to dilute the new Land Acquisition Act and reduced drastically the funds for MGNREGA, fertilizer subsidies, irrigation and other social sectors (Ghosh 2015). A report in The Wire (Kapoor 2016) has described the agrarian states of Bihar, UP and Jharkhand as ‘tinderboxes waiting to catch fire’ – the unrest and conflict being attributed to lack of jobs, food and other basic necessities. Agriculture is no longer the mainstay of rural livelihoods. Usami and Rawal’s (2018) analysis of NSS data (2004-05 and 2011-12) shows that the share of total employment in agriculture fell sharply, from 73.7 percent in 1993–94 to 59.4 percent in 2011–12. Dependence on agricultural employment is, however, a gendered phenomenon. Mondal et al. (2018) say that almost 75 percent of rural women are still engaged in agriculture. also impede women’s mobility. Declining female work participation rate is also indicative of a lack of skill training and employment opportunities that can be combined with care and reproductive economy responsibilities in addition to that of own cultivation. While the shift to rural non-farm employment is occurring across all classes, it is more the case for poor rural households – at the bottom it is distress driven as labourers pursue occupational multiplicity in hope of minimizing risk. SCs and landless are disproportionately represented here. At the top of the rural caste and class hierarchy, diversification is indicative of high educational attainments, business and trade, their wealth and social status and their access to political networks (Harriss-White & Janakarajan 2004 & Harriss-White 2008). companies to sell expensive new seed varieties, of non-traditional crops, to the poor farmers who are lured by high output prices. But these new seeds and crop varieties are water guzzlers, so the farmers need to arrange for irrigation by hiring private pumps and motors because the state no longer does so. These seeds are also more vulnerable to diseases, so the farmers need to now purchase expensive chemical pesticides to protect their crop too. To meet this cost structure, farmers have to borrow money. In the absence of the state, farmers borrow from the large farmers/ landowners in their village, from traders, from the agents of various input companies, from micro-credit societies (neoliberalism’s preferred way out of poverty and a route for women’s empowerment). They borrow against their land or labour or by pledging to sell their output to the creditor at a pre-arranged price, etc. These borrowing arrangements usually charge interest rates on a monthly basis, the interest rate being very high. All this takes place in a macro environment of the state having decontrolled prices, reduced trade and tariff barriers – so now Indian farmers are directly impacted by international price movements in agricultural commodities, by cheaper imports, by sudden shifts in consumer demands, etc. The non-farm sector has emerged as the single most important source of alternate employment in rural economy. Mostly these are casual wage labour jobs. For example, skilled and unskilled construction work, brick kiln workers, working as drivers, tutors, as domestic help, casual labour in sugarcane factories and rice and flour mills, as shop attendants or salespersons in nearby markets, etc. Though these jobs pay better than agricultural wage labour, they are not without their attendant forms of exploitation. For example, debt bondage and unpaid family labour are common in brick kilns. Social identity filters the jobs involving working inside a house. For example, a Dalit domestic worker has to wash utensils in the courtyard outside the house, using a separate hand pump. He or she is not allowed to enter the kitchen inside the house. What we have today are classes of labour simultaneously engaged in various types of irregular and exploitative wage labour, migrant work, self-employment activities and other value adding labour activities. These are combined with small-scale farming. Logically then, labour is highly mobile, fragmented and straddling different production locations and spaces in the divisions of labour (Lerche 2010). As such, the agrarian distress and crisis that we speak of is one that is lived everyday. In the increasing marginality of the ‘rural/agrarian’ – which tends to occupy public imagination and debate only when cases of farmer suicides pop up– there is a further marginalization and muting of small farmers and agricultural labourers – who today constitute the bulk of agricultural-cum- rural workers. Both men and women are diversifying out of agriculture, men more than women though. Such feminization of agriculture is not to be celebrated. A patriarchal ideology and local socio-cultural traditions confine women to the village where agriculture continues to be their most important (but insufficient) source of food and income. Male outmigration has also pushed women into taking on more responsibility of own cultivation and to perform wage labour to ensure daily households survival. In a situation of declining agricultural employment without a corresponding increase in rural non-farm jobs, women are the worst affected. Lack of basic amenities, safety concerns What makes this picture of rural employment particularly complex is the fact that employment relations in the countryside are shaped by a political-economy of difference based on gender, caste and class. India’s rural labour market is actually very well structured and regulated by these axes of inequalities. Moreover, rural employment relations have to be understood against the backdrop of wider village based social, economic and political relations of dominance and subjugation. So, the very institution of labour market that is supposed to be a possible way out of poverty and humiliation ends up reiterating 2.3 Rural Employment Today, India no longer has a robust developmental state investing in rural infrastructure, social sectors or in employment generation or poverty alleviation programmes. What we do have is a neoliberal state whose mandate is to enable the market by partnering it or moving out of its way. This the state does by way of allowing private If agriculture has been in crisis for so many years now, as has been the situation of rural distress – what does this mean for livelihoods and jobs in rural India? 46 47
THE STATE OF EMPLOYMENT IN INDIA 2 Inequality and Rural Employment these inequalities. This is particularly true for Dalits in general and Dalit women more so. I elaborate on this below with reference to Dalit women belonging to labouring households and who, in the face of men migrating and moving out of agriculture, continue to be disproportionately concentrated in demeaning and least paid agricultural and related work disproportionately. The point is illustrated further in the following section with the help of village based field studies. This part of the discussion will draw on secondary data and qualitative field based studies. preponderance of Dalits in casual labour – as comes across clearly from the figures mentioned below. According to the India Exclusion Report 2016, even where Dalits own land, they are mostly marginal and small farmers and their land is of very poor quality. It reports that about 56 percent of women headed households were landless – indicating multiple layers of exclusion. Field based village studies show that there is a strong overlap between caste position and not just land but also asset and wealth ownership (Mehrotra 2013, Ramachandran et al. 2010, Swaminathan and Rawal 2015, Kumar 2017, Swaminathan and Das 2017).3 the landless and the poorest are not always likely to migrate. deHaan (1997, 1999) has argued that in certain cases, the landless are less likely to migrate because they cannot afford the expense of it and they lack the necessary social contacts. Guerin et al. (2012), in the context of brick kiln migration in Tamil Nadu, also found that in a wet area, labourers are less likely to migrate. Labourers derive a strong sense of identity from the village or lack connections or do not want to miss out on the benefits associated with patron- client relations. agricultural self-employment is less and is largely a male preserve. Such activities (for example, peddlers, tailors, etc. reflect a minimal asset base (for example, a cycle, a sewing machine). They certainly pay more than what one can earn as an agricultural wage but come nowhere close to providing a decent regular wage. These jobs are nonetheless socially more esteemed than agricultural work which is seen as dirty and dishonourable (Jodhka 2008). There is also a strong overlap between caste and bondage – Dalits are overwhelmingly bonded labourers (India Exclusion Report 2013-14). Rural women workers continue to be mostly in agriculture. This is all the more true as their male relatives leave villages in search of year round and better paying seasonal work. The feminization of agricultural labour is more of a fact today as men are moving out of agriculture into rural non-farm employment or are migrating to work in other productive sectors in towns and cities. Returning migrants are unlikely to engage in agricultural wage labour because they see it as dirty and demeaning work which pays very less and wages are often delayed. What this indicates is that women are left to bear more responsibility of agricultural labour and everyday household survival but without any improvement in their position in the labour market or in their families. The government also does not recognize women as farmers and give them legal right to land4. Migrant work offers possibilities of economic and social mobility – but because of various reasons rural women workers are denied even this possibility.5 In fact, Mehrotra (2013, 2017) has established that male outmigration is linked to withdrawal of women from wage labour and them bearing the uneven burden of unfree 2.4 Rural Employment and the Precarious Position of Dalit Women Damodaran (2015), drawing on SECC results, reports that there has been a delinking of rural and agriculture. Three-fourths of the total households in the country are in rural areas but for only 30 percent of them cultivation is the ‘main’ source of income. Just over 50 percent of rural households actually depend on ‘manual casual labour’ for their survival. At the top of the rural hierarchy are upper caste-class households whose income sources may still be significantly agrarian (farming, trade, retail, moneylending, renting out of machinery, etc.). But at the bottom of the rural hierarchy are the labouring households which are mainly Dalit who derive most of their income from a combination of sources. According to Mehrotra (2013, 2017), they combine own cultivation with wage labour, migrant work and petty self-employment activities in their struggle for survival. However, diversification away from agriculture is strongly gendered with men resorting to non-farm work (in villages and nearby urban centres) and migrant work to a much greater extent. With respect to self-employment, scope for rural non- Land occupies a central position in the lives of labourers – as an economic asset and for socio- cultural and religious reasons. Land position is an important determinant of labour relations. The incidence of landlessness is high among women in general. According to an Oxfam report, about 85 percent of rural women in India are engaged in agriculture but only 13 percent of them owned land (Oxfam 2018). In the case of Dalits, landlessness is high and given patriarchal norms and cultural bias, it is possible that landownership among Dalit women would be even worse. One would assume that in the absence of agricultural land, men from Dalit labouring households would migrate to town and cities in search of employment. This is the general picture but needs to be nuanced further. For example, landless Musahar men from eastern Uttar Pradesh did not migrate. As men are more likely to find employment in and around villages, they needed to stay behind in the village to provide for their families. This was also because they live in a nuclear family set up and there were no other family members to take care of their families while they were away. So, To begin with, a few facts about rural labour market with reference to Dalits. Land is an important socio-economic asset. Drawing on government figures, Firstpost reports that in the period between 1991 and 2004-05, landlessness increased from about 40 percent to about 52 percent (Mohanty 2018). About 56 percent of rural households don’t own agricultural land and the incidence of landlessness is the highest among Dalits (Damodaran 2015).The share of land owned in rural India by different social groups was 13.06 percent for STs, 9.23 percent for SCs, 45.68 percent for OBCs and 32.03 percent for others (NSSO 2013). According to Thorat and Madheswaran (2018), in livestock and farm equipment, the share of SCs is 11.7 percent, 43.8 percent for OBCs, 25.5 percent for Higher Castes and 18.9 percent for the rest. The high degree of landlessness among Dalits also means 4 The World Bank (2018) has reported that property right to women can secure them as producers of food and increase food production. 3 For detailed data see Ramachandran et al. (2010), Swaminathan and Rawal (2015) and Swaminathan and Das (2017). See these works also for employment and income patterns. 5 Migration can also exacerbate the experience of social discrimination. For example, see Raj (2018). 48 49
THE STATE OF EMPLOYMENT IN INDIA 2 Inequality and Rural Employment labour relations. Returning migrants do not want their women to continue working in the field of upper caste-classes because it is reflection on their honour and pride – that as breadwinners they could not provide for their family. For migration, men may have initially borrowed from their employers in the village and in their absence, the women of their households provide tied or priority labour services to their creditor households. Women from Dalit labouring households, who are left behind in the village, actually continue to do wage labour without the knowledge of their male relatives. They do so because for them, their employers are a source of social protection in situations of family emergency, medical need, marriage, etc. They act as a source for credit and for negotiating with the state to access various public schemes, etc. Dalit labourers are dependent on their employers for access to the employer’s fields for grazing their livestock, for defecation, for employment, for fodder, etc. Unlike men, women are held captive in local village based economy due to care and reproductive economy responsibilities. Inside the village, agriculture still continues to be the main source of income for women labourers. There are hardly any off-farm opportunities available inside the village that they can combine with their other responsibilities. Where women undertake home based work as a part of various putting out arrangements, their work participation wages, skills and wages are determined by local value systems and patriarchal norms (for example, see Mezzadri 2016). In sum, labour relations of Dalit women are a part of wider village-based social, economic and political relations of dominance and subjugation and are shaped by class, caste and gender identities. (clean, reflect some educational attainment) and workers hold the hope that eventually the Sarkar would regularize them. transplantation. Gendered division of labour in agriculture has been observed for decades now (Kapadia 1995 and Breman 2007). According to da Corta and Venkateshwarlu (1999), this gendered division of labour is also class division between ‘a non-propertied/waged workforce composed of women…and self-employed men…’ (104). What is important to note is that women perform these ‘male’ tasks in their own fields, indicating how patriarchy sustains gendered socio-economic roles or the male breadwinner and women in a supplementary economic role. It is a striking fact that livelihood activities, that is, activities that help in household reproduction but do not have a monetary value, or at least not immediately, are carried out solely by women. These activities include collecting firewood, making and storing cow-dung cakes and, very importantly, providing unpaid labour to upper caste-class families, for example, by sweeping their courtyards, tending their livestock and cleaning and drying their grain. This gendered division of labour is rarely broken even where government programmes such as MGNREGA are concerned. In fact, where non-farm employment is concerned, the greatest increase has been seen in construction and for women this has primarily been under MGNREGA. This highlights the importance of public programmes in providing employment for the most marginalized, breaching barriers of social identities. this gender wage gap to discrimination rather than endowment effect.6 Wage relations are also influenced by interlocked or tied land, labour and credit linkages between women labourers and their employers (Mehrotra 2013, 2017; Das Gupta 2019). For example, women belonging to indebted households are expected to provide priority labour to their employer-cum-creditor household during the peak season. These women may even have to accept wages lower than the prevailing market rate or may be paid partially or later than other labourers. Mehrotra’s work (2013, 2017) shows that even today one can find instances where, across caste groups, women (individually or as part of family) have continued with traditional caste occupations. For example, the older Chamar women worked as dais, helping with child birth. Baniyas are majorly into small businesses and elderly women of these households also help out at shops. For example, kirana shops, shops dealing in fertilizers, clothes, utensils, building materials, stationery, etc. The poorer baniyas work as vendors and peddlers, moving from village to village on their cycles, selling small items such as cosmetics, fruits and vegetables or cooked food items. Ahir families sell milk and milk products. Here, there are two interesting things to note. One is that while women make curd at home, it is men who sell milk and curd to the shops in the market. It is men who enter the market, who make the sale, who earn and control the income. The second thing to note is that other labouring households also sell milk to shops or milkmen who come to the village. However, milk from Dalit households gets sold at a much lower rate. They also don’t make curd. What this means is that caste decisively decides how one participates in the market and with what outcomes. So, Dalits or even other households sell only milk and not milk products In the case of rural women in general, there has been very limited occupational diversification. Mondal et al.’s (2018) study of NSS data shows that almost 75 percent of rural women continue to be in agriculture. Outside of agriculture, rural women work as para-teachers and health workers, in construction, garments, domestic work, etc. Much of this diversification is because of government initiatives such as SSA, RMSA, NRHM and MGNREGA. This again highlights the role of government in employment generation in rural areas, specifically for women. However, in comparison to regular jobs, much of this employment is contractual and remunerated at a lower rate. In fact, ASHAs and ANMs are categorized as volunteers and paid honoraria. In much like the upper caste-class employers of these women workers, the mai-baap government actually benefitted from a readily available cheap labour force, in the process reifying occupational segregation. My own research indicates that even these are much coveted jobs and captured by the not so poor. These are coveted because they pay much more than agricultural wage labour and are perceived as relatively prestigious jobs ‘Bound’ as they are to the village and to agriculture, Dalit female labourers have borne the brunt of steadily declining agricultural employment. Add to this the fact that female wages, in general, are anyways very low and their wage relations are not just an economic contract. A recent report in DownToEarth, citing figures released by the Ministry of Agriculture, says that women farmers and agricultural labourers are paid 22 percent less than male farmers and agricultural labourers (Pandey 2018). Drawing on NSS data, Mondal et al. (2018) have attributed much of Within agriculture there is a sexual division of labour, enforced by an internalized patriarchal ideology. Women are confined to the least paid tasks such as weeding, threshing and paddy 6 Endowment factors include education, capital assets, etc. Differences in endowment may be a possible explanation for income and employment differences. 50 51
THE STATE OF EMPLOYMENT IN INDIA 2 Inequality and Rural Employment because that is seen as the job of Ahirs. Also, milk from Dalit labouring households is not much in demand and also does not fetch the market rate. Such discrimination is also seen in the case of self-employed Dalits. Caste based spatial organization of villages means that the customer base for home based Dalit kirana shops is also mostly Dalit or middle castes from neighbouring hamlets. Their tiny shops which are more like a stall have a small stock and since social and economic relations overlap, their customers may pay less or pay later. is being redistributed, single titles in favour of women should be prioritized and in the case of private land, joint titles should be given. In a country with patriarchal norms, joint titles may be preferred and more pragmatic. As such, the government should consider removing registration fees and stamp duty in cases where a single title is being converted into joint ownership of husband and wife (Oxfam 2016). income we need to secure them institutional and infrastructural support. A step in this direction has been the proposal by the latest Economic Survey (2017-18) to design a women farmer friendly policy in terms of targeting access to land, water, credit, technology and training (Sally 2018). One does wonder, however, who these women farmers the government is talking about are? Since landownership is essential to be recognized as a farmer in official statistics, most women would be outside the purview of any such policy. Dalit women. Only the poorest of the poor, men from the landless Musahar community worked at the brick kilns under extremely oppressive terms and conditions of work involving bonded and unpaid family labour. A recent Anti-Slavery International report (2017) on brick kiln workers in India documents that most of the workers are from marginalized communities. Moulding of bricks is paid on piece rate basis, so while it is the man who is the ‘worker’, actually it functions on family labour, where the entire family is engaged in work to mould as many bricks as possible in an attempt to maximize income. Recruitment is debt based, child labour is very common, wages are less than the prescribed minimum, basic amenities are also absent. While the law gives men and women the right to agricultural property, has effectively kept women deprived from the realization of this right. Moreover, states continue to follow discriminatory state laws, personal laws or customary laws on agricultural land (for details, see Oxfam 2016). Here, there is need to bring some sort of uniformity in inheritance of agricultural land. In other words, more concerted efforts are needed for the implementation of the Hindu Succession Amendment Act 2005, to provide women with clear land titles and to monitor the performance of courts and bureaucrats on this front (Oxfam 2013, 2016). Women are the ‘tillers’ today. Having land in their name will boost their productivity and efficiency. As holders of land title, they can directly access formal credit. This will also lead to official recognition of women as farmers and lend visibility to their work. Over a period of time, this will also have multiplier effects in terms of better educational and health outcomes, food and nutrition security and perhaps, eventually put a significant dent in patriarchal norms of the Indian society. Leasing of land through cooperatives or SHGs may also be considered to enable women access land and realize economies of scale. For example, Kudumbashree in Kerala and Deccan Development Society in Telangana. male preference What the above discussion? Given below are some recommendations that the government of the day must consider in designing appropriate policies on rural employment, especially for women: policy considerations emerge from Socio-cultural determinants of female rural employment. For example, the case of brick kiln work which is one of the most exploitative and stigmatized types of work is characterized by bonded labour to a significant extent. Women from patriarchal north Indian states such as Uttar Pradesh typify brick kilns dotting the area around their villages as sites of sexual harassment and alcohol production. The female body is seen as the site of family ‘honour’ and ‘purity’ and for these women to work alongside strange men, who are not even locals (incoming migrants from Ranchi), would be morally unacceptable. To go searching for work behind their husbands’ backs is deemed even more objectionable because this signals that they are loose women who cannot live on their husbands’ earnings. The local Dalit women regularly slandered the ‘different’ incoming female labourers from Ranchi: for their work- style attire (saree draped in a dhoti style which is divided in the middle to allow greater mobility), for carrying their children in slings on their backs while working, for being loud-mouthed and abusive and for brewing and selling alcohol - the very opposite of the conservative patriarchal local female ideal type which was epitomized by the women from the upper caste-classes who, docile and dependent, were confined to their households. This was the norm aspired to by poor factors also are important 2.5 Policy Suggestions (i) Agriculture needs to be made a priority, not just as a productive sector but for equity and employment. There is need for increased public investment in irrigation, research and extension services, input subsidies, better storage and transport facilities, etc. The state needs to undertake long-term investment in rural development and employment generation schemes and not stifle these with funding cuts and technology obsession.7 Given the preponderance of rural women in agriculture, the policy has to cater to women’s interest in terms of extending credit, access other infrastructural support. This chapter began with an understanding of rural labour markets as arenas of unequal power relations exploiting social identities such as caste and gender in the pursuit of capitalist accumulation. Simultaneously, India’s labouring poor who are more than likely to be Dalits and Adivasis, are made more vulnerable. It then went on to illustrate that neoliberalism has intensified rural distress and one dimension of this is a severe crisis of rural employment. It can be linked to the large-scale mechanization and cropping pattern shift in agricultural policy in the period. While these phenomena have pushed men out of village economy, they have pushed women into a precarious kind of labour position. Within villages, the brunt of this has been borne by women and these are more than likely to be from Dalit and Adivasi rural labouring households. Gender needs to be understood as intertwined with caste and class. Inside India’s villages, poverty, unemployment and unfreedom have a female face. There is an urgent need to recognize this fact and take action along the lines suggested above. If women are the tillers, then for food and (ii) Even though land alone cannot improve the overall position of rural women, ensuring land rights to women is imperative for a variety of reasons. Despite a policy framework on land rights for women, implementation remains a huge challenge. In this context, Oxfam (2013) has recommended that where government land 7 For instance, see Ghosh (2015) and Srivastava (2018) on how funding cuts and Aadhaar are affecting the rural poor. 52 53
THE STATE OF EMPLOYMENT IN INDIA 2 Inequality and Rural Employment Leasing in of land by women farmers’ collectives needs to be backed by appropriate legal framework to ensure a secure and reasonable lease period which in turn would incentivize investments in land and enhance livelihood security (Oxfam 2013, 2016). The government, by providing some seed money and enabling access to credit, can help women farmers’ collectives to overcome financial limitations and improve their bargaining position in the market vis-a-vis those who are unwilling to lease land to women. Rising consciousness about the health and environmental consequences farming has led to increasing demand for organic food products (especially seen in upscale classes and hotels of metropolitan cities). Might then one think of helping rural farmers adopt organic farming methods and integrate them in local chain network as suppliers of organic produce? In other words, traditional knowledge can also be adapted into lucrative business models. infrastructure such as electricity, computers and internet connectivity. Simultaneously, there is need to change social attitudes as well. Women can also be main breadwinners. One should be careful though of attendant forms of exploitation in home-based work – distress self-employment, drawing on family labour, etc. Because the state has somewhat successfully challenged gendering of work roles as seen in MGNREGA, perhaps, the state needs to take a more direct and hands on role in village based skill training and employment generation for women. Skill training and upgradation is an important way of improving the employability of rural people, especially women, who are faced with various barriers (for example, training fees, inflexible schedules, high transportation costs, gendered social roles and households responsibilities, etc) in accessing education and technical or vocational training. Not only is it important to ensure that skill training matches labour market requirements, but ways of gender friendly training can also be explored. For example, providing transportation and child care facilities, combining skill training with building confidence and leadership skills, developing a flexible training schedule, etc. (vii) Formulation of appropriate policy response requires reliable data. The importance of land rights for women is abundantly clear from the above point, but unfortunately official statistics do not capture how many women own land (whether agricultural or homestead). Data is also required to gauge the effectiveness of policy. For example, an Oxfam brief (2016) reports that there is no reliable country level data on whether women indeed received joint titles as mandated by the government from the mid-1990s. The lack of data handicaps appropriate policy planning targeting women. The same policy brief recommends the institution of a policy to collect sex-disaggregated data on women’s ownership of all kinds of land. of chemical (vi) For long, the assumption has been that women do not want to work. Actually, the problem lies in the type and location of work which stops women from working. They fear backlash from society and their own families if they turn to ‘new’ types of employment. Location of the work is important because women have to combine this work with other household chores, own cultivation and care and reproductive economy responsibilities. So there is need to devise appropriate employment opportunities in the vicinity of the household. Work that has traditionally been typecast as ‘man’s’ is unlikely to find any takers from women workers even if it is locally available. Here, the presence of state matters – as seen above in the case of women engaging in construction work under MGNREGA. Outside of agriculture, tailoring, weaving, bidi making, processing are seen as women’s tasks. Here, efforts on various fronts are required. Various stakeholders should provide opportunities for learning tailoring or weaving skills, opportunities for related learning such as designing, embroidering, crocheting, knitting, etc. Skill upgradation is important and would also be more value adding. Such programmes would mean little without institutional support in terms accessing training, formal credit or seed money and market linkages. Here, the role of technology in imparting skill lessons or linking women to e-retailers may be more pragmatic considering the restrictions on their mobility. This would also entail ensuring (iii) Recent policies have disproportionately focused on machine-driven agriculture. In addition, NREGA was offering rural employment –with regional variations – which has seen a decline in last few years. In this context, turning to labour intensive techniques in rural industrialization – food processing and packaging, boosting the arts and crafts sector, etc. can address the situation. The state needs to play an important role in ensuring institutional and infrastructural support through research and extension services catering specifically to women farmers, provisioning of credit, building irrigation and storage facilities, by ensuring that inputs are subsidised and made available through government shops, by investing in R&D for small-scale and women friendly machines, by making sure that crèches and centres for the elderly and worksites are equipped with basic amenities such as toilets and drinking water, etc. The problem here is that in the absence of landownership, women do not get recognized as farmers, resulting in their exclusion from government schemes. Oxfam (2013) has suggested delinking entitlements for farmers from landownership. Oxfam (2013) also recommends affirmative action to improve women’s access to schemes – there should a mandatory 33 percent reservation for women in all public schemes supporting women farmers. References Anti-Slavery International. 2017. Slavery in India’s Brick Kilns & the Payment System. Available at http://www.antislavery.org/wp-content/uploads/2017/09/Slavery-In-Indias-Brick-Kilns-The- Payment-System.pdf. Accessed on 14 January 2019. Bakshi, Aparajita. 2008. ‘Social Inequality in Land Ownership in India: A study with particularreference to West Bengal.’ Available at:http://www.networkideas.org/wp-content/uploads/2016/10/Land_Ownership.pdf. Accessed on 3 February 2019. Bernstein, Henry. 2010. Class Dynamics of Agrarian Change. Canada: Fernwood Publishing. Breman, Jan. 2007. The Poverty Regime in Village India: Half a Century of Work and Life at the Bottom of the Rural Economy in South Gujarat. New Delhi: Oxford University Press. Centre for Equity Studies. 2014. India Exclusion Report 2013-14. New Delhi: Centre for Equity Studies. 54 55
THE STATE OF EMPLOYMENT IN INDIA 2 Inequality and Rural Employment Chandrasekhar, C.P. 2017. ‘The Roots Of The Agrarian Disress In India’. BloombergQuint, 27 June 2017. Available at: https://www.bloombergquint.com/opinion/2017/06/27/farm-loan-waivers-and-the-roots-of-agrarian- distress-in-india#gs.76WQ5aQc.Accessed on 22 November 2018. Harriss-White, Barbara and S. Janakarajan. 2004. Rural India Facing the 21st Century: Essays on Long Term Village Change and Recent Development Policy. London: Anthem Press. Institute for Human Development. 2014. India Labour and Employment Report 2014: Workers in the Era of Globalisation. New Delhi: Academic Foundation. Chandrasekhar, C.P. and J. Ghosh. 2018. ‘India’s services sector boom has failed on the jobs front’, BusinessLine, 19 November. Available at https://www.thehindubusinessline.com/opinion/columns/c-p-chandrasekhar/ indias-services-sector-boom-has-failed-on-the-jobs-front/article25540761.ece. Accessed on 25 January 2019. Jodhka, S. 2008. ‘The Decline of Agriculture.’ In Reforming Indian Agriculture edited by Sankar K. Bhaumik. New Delhi: Sage Publications. ——. 2002. The Market that Failed: Neoliberal Economic Reforms in India. New Delhi: LeftWord Books. Kannan, K.P. 2018. ‘Macro-Economic Aspects of Inequality and Poverty in India’.In Ground Down by Growth: Tribe, Caste, Class and Inequality in Twenty-First Century India by Alpa Shah, Jens Lerche, Richard Axelby, Dalel Benbabaali, Brendan Donegan, Jayaseelan Raj and Vikramaditya Thakur. New Delhi: Oxford University Press. daCorta, Lucia and Davuluri Venkateshwarlu.1999. ‘Unfree Relations and the Feminisation of Agricultural Labour in Andhra Pradesh, 1970-95’. In ,Rural Labour Relations in India edited by T.J. Byres, Karin Kapadia and Jens Lerche. London: Frank Cass. Chapter 4. Kapadia, Karin. 1995. Siva and her Sisters: Gender, Caste, and Class in Rural South India. Boulder: Westview Press. Damodaran, Harish. 2015. ‘Socio-economic Status: Five key takeaways from SECC’. Indian Express, 9 July 2015. Available at https://indianexpress.com/article/india/india-others/five-key-takeaways-from-secc/. Accessed on 13 January 2019. Kapoor, Abeer. 2016. ‘Agrarian Riots And Rural Distress: Is India’s Countryside Burning?’ The Wire, 19 October 2016. Available athttps://thewire.in/agriculture/is-the-countryside-burning. Accessed on 25 January 2019. Das Gupta, S. 2019. Class, Politics, and Agrarian Policies in Post-liberalisation India. New Delhi: Cambridge University Press. Kumar, Deepak. 2017. ‘Landholdings and Irrigation in the Study Villages’. In Socio-Economic Surveys of Three Villages in Karnataka edited by M. Swaminathan and Arindam Das. New Delhi: Tulika Books. ——. 2014. Class Interest Shapes Political Decisions: a case-study of agricultural policies in post-liberalisation Indian states of Chhattisgarh, Gujarat and Karnataka. Unpublished PhD thesis. Awarded by School of Oriental and African Studies, University of London. Lanjouw, P. and A. Shariff. 2004. ‘Rural Non-Farm Employment in India: Access, Incomes and Poverty Impact’. Economic and Political Weekly, Vol. 39, No. 4. Lerche, Jens. 2010. ‘From “rural labour” to “classes of labour”: class fragmentation, caste and class struggle at the bottom of the Indian labour hierarchy.’ In The Comparative Political Economy of Development: Africa and South Asia edited by Harriss-White, Barbara and Judith Heyer. London: Routledge. deHaan, Arjan. 1999. ‘Livelihoods and Poverty: The Role of Migration-A Critical Review of the Migration Literature’. The Journal of Development Studies, Vol. 36, No. 2. pp. 1-47. ——. 1997. ‘Rural-Urban Migration and Poverty: The Case of India.’ IDS Bulletin. Vol. 28, No. 2, pp. 35-47. Levien, Michael. 2012. ‘The land question: special economic zones and the political economy of dispossession in India’. The Journal of Peasant Studies, Vol. 39, Nos. 3-4, pp.933-969. Ghosh, Jayati. 2015. ‘India’s rural employment programme is dying a death of funding cuts’, The Guardian. Available at https://www.theguardian.com/global-development/2015/feb/05/india-rural-employment- funding-cuts-mgnrega. Accessed on 14 January 2019. Mehrotra, Ishita. 2017. ‘Subsidising capitalism and male labour: The scandal of unfree Dalit female labour relations’. In Dalit Women: Vanguard of an Alternative Politics in India edited by S. Anandhi and Karin Kapadia. Oxon: Routledge. ——2005. ‘Trade Liberalization in Agriculture: An Examination of Impact and Policy Strategies with Special Reference to India.’ Occasional Paper [Online], Human Development Report Office. Available at http://hdr. undp.org/sites/default/files/hdr2005_ghosh_jayati_12.pdf. Accessed on 29 January 2019. ——. 2013. Political Economy of Rural Female Labour: A Study of Labour Relations in East Uttar Pradesh (UP), India. Unpublished PhD thesis. Awarded by School of Oriental and African Studies, University of London. Government of India (GOI). 2008. A Special Programme for Marginal and Small Farmers. New Delhi: National Commission for Enterprises in the Unorganised Sector. Mezzadri, Alessandra. 2016. ‘Class, gender and the sweatshop: on the nexus between labour commodification and exploitation’. Third World Quarterly. Vol. 37, Issue 10, pp. 1877-1900. ——. 2007. Report on Conditions of Work and Promotion of Livelihoods in the Unorganised Sector. New Delhi: National Commission for Enterprises in the Unorganised Sector. Mohanty, Prasanna. 2018. ‘India’s Landless Poor: Amid rising rural poverty and lower access to land, empowering this group must be priority’. Available at https://www.firstpost.com/india/indias-landless-poor- amid-rising-rural-poverty-and-lower-access-to-land-empowering-this-group-must-be-priority-5338711.html. Accessed on 3 February 2019. ——National Sample Survey Organisation, 70th Round 2013. Situation Assessment Survey of Agricultural Households, All India Debt and Investment & Land and Livestock Holdings in India (January 2013 – December 2013). Mondal, Bidisha, Jayati Ghosh, Shiney Chakraborty, and Sona Mitra. 2018. ‘Women Workers in India’. CSE Working Paper 2018-3. Bengaluru: Centre for Sustainable Employment, Azim Premji University. Guerin, Isabelle, S. Ponnarasu, G. Venkatasubramanian and S. Michiels. 2012. ‘Ambiguities and Paradoxes of Decent Work Deficit: Bonded Migrants in Tamil Nadu’. Global Labour Journal. Vol. 3, Issue 1. Oxfam International. 2018. ‘Move over “Sons of the soil”: why you need to know the female farmers that are revolutionizing agriculture in India’. Available at https://www.oxfamindia.org/women-empowerment-india- farmers. Accessed on7 February 2019. Harriss-White, Barbara. 2008. Rural Commercial Capital: Agricultural Markets in West Bengal. New Delhi: Oxford University Press. 56 57
THE STATE OF EMPLOYMENT IN INDIA 2 Inequality and Rural Employment ——. 2017. An Economy for the 99%.Available at https://d1tn3vj7xz9fdh.cloudfront.net/s3fs-public/file_ attachments/bp-economy-for-99-percent-160117-summ-en.pdf. Accessed on 2 February 2019. Srivastava, Pragya. 2018. ‘MGNREGA workers have become guinea-pigs for Aadhaar Payments System’. Financial Express, 16 July 2018. Available at https://www.financialexpress.com/economy/jean-dreze-exclusive- mgnrega-workers-have-become-guinea-pigs-for-aadhaar-payments-system/1246759/. Accessed on 14 January 2019. ——. 2016. An Economy for the 1%. Available at https://d1tn3vj7xz9fdh.cloudfront.net/s3fs-public/file_ attachments/bp210-economy-one-percent-tax-havens-180116-summ-en_0.pdf. Accessed on 2 February 2019. Sud, Nikita. 2009. ‘The Indian State in a Liberalizing Landscape’. Development and Change. Vol. 40, Issue no. 4, pp. 645–665. Pandey, Kiran. 2018. ‘Hard work, but low wages for women farmers’. DownToEarth, 18 September 2018. Available at https://www.downtoearth.org.in/news/agriculture/hard-work-but-low-wages-for-women- farmers-61656. Accessed on 14 January 2019. Swaminathan, Madhura and Arindam Das (eds.). 2017. Socio-Economic Surveys of Three Villages in Karnataka. New Delhi: Tulika Books. Patnaik, Utsa. 2003. ‘Agrarian Crisis and Distress in Rural India’. Available at http://www.macroscan.org/fet/ jun03/fet100603Agrarian%20Crisis_1.htm. Accessed on 25 January 2019. Swaminathan, Madhura and Vikas Rawal. 2015. Socio-Economic Surveys of Two Villages in Rajasthan. New Delhi: Tulika Books. Raj, Jayaseelan. 2018. ‘Tea Belts of the Western Ghats, Kerala’. In Ground Down by Growth: Tribe, Caste, Class and Inequality in Twenty-First Century India edited by AlpaShah, Jens Lerche, Richard Axelby, Dalel Benbabaali, Brendan Donegan, Jayaseelan Raj and Vikramaditya Thakur. New Delhi: Oxford University Press. Thorat, S. and S. Madheswaran. 2018. ‘Graded Caste Inequailty and Poverty: Evidence on Role of Economic Discrimination’. Journal of Social Inclusion Studies. Vol. 4, Issue no. 1, pp. 3–29. Ramachandran, V.K. and Vikas Rawal. 2010. ‘The Impact of Liberalization and Globalization on India’s Agrarian Economy.’ Global Labour Journal, Vol.1, Issue 1, pp.56-91. Usami, Y. and Vikas Rawal. 2018. ‘Changes in the Structure of Employment in India’. SSER Monograph 18/2. Available at http://www.networkideas.org/wp-content/uploads/2018/08/Changes_Structure_Employment India.pdf. Accessed on 25 January 2019. Ramachandran, V.K., Vikas Rawal and Swaminathan. (eds). 2010. Socio-Economic Surveys of Three Villages in Andhra Pradesh: A Study of Agrarian Relations. New Delhi: Tulika Books in association with Foundation for Agrarian Studies. The World Bank. 2018. ‘Breaking the ‘Grass Ceiling’: Empowering Women Farmers.’ March 6. Available at http:// www.worldbank.org/en/news/feature/2018/03/06/breaking-the-grass-ceiling-empowering-women-farmers. Accessed on 3 February 2019. Rawal, Vikas and Partha Saha. 2015. ‘Women’s Employment in India’. SSER Monograph 15/1. New Delhi: Society for Social and Economic Research. Available at http://archive.indianstatistics.org/misc/women_work.pdf. Accessed on 25 January 2019. ——. 2009. What is Inclusive Growth? Available at https://siteresources.worldbank.org/INTDEBTDEPT/ Resources/468980-1218567884549/WhatIsInclusiveGrowth20081230.pdf. Accessed on 25 January 2019. Reddy, Narasimha D. and Srijit Mishra (eds). 2009. Agrarian Crisis in India. New Delhi: Oxford University Press. Rustagi, Preet. 2015. ‘Employment and Inequalities’. Round Table on Addressing Economic Inequality in India, Bengaluru, 8 January 2015. Saad-Filho, Alfredo. 2010. Growth, Poverty and Inequality: From Washington Consensus to Inclusive Growth. DESA Working Paper No. 100. Available at https://www.un.org/esa/desa/papers/2010/wp100_2010.pdf. Accessed on 25 January 2019. Sainath, P. 2015. ‘The Slaughter of Suicide Data’. Available at https://psainath.org/the-slaughter-of-suicide- data/. Accessed on 18 December 2018. Sally, Madhvi. 2018. ‘Economic Survey: Emphasis on women farmers for rural transformation’. Available at https://economictimes.indiatimes.com/news/economy/agriculture/economic-survey-emphasis- on-women-farmers-for-rural-transformation/articleshow/62693042.cms. Accessed on 2 February 2019. Sengupta, A., K.P. Kannan and G. Raveendran. 2008. ‘India’s Common People: Who Are They, How Many Are They and How Do They Live?’ Economic & Political Weekly. Vol. 43, Issue No.11. Shah, Alpa, Jens Lerche, Richard Axelby, Dalel Benbabaali, Brendan Donegan, Jayaseelan Raj and Vikramaditya Thakur. 2018. Ground Down by Growth: Tribe, Caste, Class and Inequality in Twenty-First Century India. New Delhi: Oxford University Press. 58 59
THE STATE OF EMPLOYMENT IN INDIA 2 Inequality and Rural Employment Why India Migrates By Savvy Soumya Misra In the last week of October, the CPI (ML) in Bhojpur’s Sahar block in Bihar held a three-day chakka jam. They were protesting the use of JCBs (earth moving heavy machinery) in sand mining and demanded that locals be provided employment instead. The Son River that flows by Sahar block, and through Bhojpur, carries a lot of sand during monsoons from Madhya Pradesh making these parts very lucrative sand mines. Delhi to work on construction sites. The labourers working in the cities earn anything between INR 200-600 per day, depending on the level of skill involved, and in some cases work for 15- 20 days a month; this is still more consistent than the work that farms generate. There is the ploughing and sowing for wheat and legumes in January for which men are preferred and so they come back from the cities. What they send back, after spending on room rent and food, is not enough. Women have to augment this income by working as farm labourers or sharecroppers or both. Women get work in July and August (sowing of paddy) and December (during harvest). While the rates for sowing and harvesting, for women, is INR 100 per day; the weeding rates are fixed at INR 50. Women start their day early but the landowners give them no food, just a couple of biscuits sometimes. is slow. They are paid INR 500 for 1000 bricks. Two people can make about 2500 a day. They sometimes get paid on a weekly basis and on other occasions, their wages are deducted from the advance they take in the beginning of the month. The brick kiln workers in Bhojpur are mostly from Gaya, where the wages are extremely low - both at the kilns and farm. These women are not kept out of the workforce on the basis of their caste. What they do discriminate in, are the wages they are paid and the working conditions. This can be improved if the women (and men) make collectives and demand better pay as was done by the Saraswati Mahila Kisaan Samooh. The wages in cash that they receive is below what men would have got; he would be paid INR 200-250 a day. And the wages would have been marginally higher, even for women, had they belonged to a backward community. They have tried to negotiate with the landowners but this has often met with the threat of replacing them with labourers from neighbouring villages. When paid in rice, the women said it was of poor quality or mixed with some chaff or feed. Over 20 Ghats in Bhojpur are auctioned for sand mining. A 2015 pre-feasibility report on sand mining in Bhojpur, stated that this would not just be economical for the state but also boost local employment providing livelihood to the poorest sections of the society, especially the ‘economically backward population and tribals in the area’1. As it turned out, this wasn’t the case. In Devnarayannagar, not far from Baruhi, due to the efforts of the Saraswati Mahila Kisaan Samooh (a part of a project of Oxfam India and Pragati Grameen Vikas Samiti [PGVS]) labourers who were hardly paid, negotiated for better wages. Musahars, is the lowest rung among the Mahadalit, and are poorly paid. Women are worse off. The landowner-labourer relationship is changing to the extent that the latter do not go to the former for loans; they borrow from within the Self Help Groups at lower interest rates. What is beginning to worry them however is the fact that with mechanization, like harvester and JCB, they might be on the losing end. The rest of the year, some women work as sharecroppers and work in groups. Susheela Devi’s husband and son, both, have left the village. She and her daughter-in-law, Basanti Devi work in farms. They are Mahadalit and belong to the Chamar community. Baruhi Ghat is one of the 24 auctioned Ghats in Bhojpur. According to the report, these 24 sand mines would have 310 working days and would need 200-250 man power2. The rural employment opportunities under the MGNREGA, too, have been few and far between. But not all opt for sharecropping or farm work. Instead of migrating to towns, they migrate to other villages. Bhangiya Devi, a Musahar in her mid-20 from Gaya district, spends a large part of her year at the brick kiln in Baruhi village. She and her family (children and husband) live in makeshift huts, travel with their pots and pans every year. They leave the kilns during the monsoons - June to September - when the work These women work in the fields for daily wages of INR 100 or 3.5 kgs of rice. The wages aren’t paid daily and are subject to the amount of work done. With employment opportunities drying up in villages, the men have migrated to Mumbai and 1 http://environmentclearance.nic.in/writereaddata/Online/TOR/0_0_10_Dec_2015_2004333131PFR-bhojpur.pdf (as viewed on Nov 9, 2018). 2 http://environmentclearance.nic.in/writereaddata/Online/TOR/0_0_10_Dec_2015_2004333131PFR-bhojpur.pdf (as viewed on Nov 9, 2018). 60 61
THE STATE OF EMPLOYMENT IN INDIA 3. WHAT MATTERS FOR URBAN WOMEN’S WORK A DEEP DIVE INTO FEMALE LABOUR FORCE participation BY Shamindra Nath Roy and Partha Mukhopadhyay 62 63
THE STATE OF EMPLOYMENT IN INDIA 3 What Matters for Urban Women’s Work? 3.1 Do Indian Women work? could rise by over 43 percent, that is, by INR 72 trillion.2 That is an estimate of the loss caused by the low level of female workforce participation. Thus, even ignoring other reasons, of which there are many, possibly more important than economic activity (see Fletcher et al. 2017 for a review), for purely economic reasons one must ask: why is labour force participation in India so unequal? India is now (in 2017), 20th from the bottom, out of 187 countries, in terms of Female Labour Force Participation (FLFP), down 18 spots from its rank during the 1990s. In South Asia, India ranks second lowest only after Pakistan and globally, it is only better than the countries of Middle-East and North Africa (20.6 percent), but significantly lower than China (61.5 percent) and countries of East Asia and Pacific (60.1 percent), as well as Latin American and Caribbean countries (51.5 percent).1 Indeed, at 16.8 percent, the latest estimate of India’s urban FLFP is much lower than that of overall Middle East levels. In 2017, out of 195 countries, India ranked 127 in Gender Inequality Index and 149 in Gender Development Index (UNDP Human Development Report). One out of three (32.2%) female workers in urban household manufacturing is Muslim. Manufacturing employs 39.2% of Muslim women, 22.9% of non-SC/ST Hindus and 20% of Hindu SC women (Census of India, 2011). Note that this does not even begin to address another important issue: is work, and therefore economic value, being measured properly? For example, care work, such as looking after people, seeing to their wants and needs, monitoring and maintaining machines, plants, animals is work that enables other work that is more socially valued to be productive. Yet, it remains largely unrecognized (see Box 3.1). This is discussed more extensively in the chapter on unpaid care work in this report. Two of the most female-intensive industries of urban non-farm work are domestic work and manufacturing of tobacco products where 80.9% and 77.5% of the workforce respectively is female. These two industries employ 8.4% of the female workforce but only 0.6% of the male workforce. (Census of India 2011) On the other hand, if Indian FLFP attained current Chinese levels, as above, it could add about 27 percent to GDP and if women in India had the same labour force participation rate (79.7 percent instead of 30.8 percent) as men, then India’s GDP The two activities employing the largest number of urban women in India are education, at 13.2%, and retail trade, at 6.1% of the female workforce, but only one out of five (20.4%) workers in these two industries is female. (Census of India 2011) Box 3.1: Who Works More? Half (49.5%) of the married women workers work in the same industry of work as their husbands (NSS EUS 2011-12). The definition of work is undergoing change, but slowly. If any ‘activity performed by persons of any sex and age to produce goods or provide services for use by others or for own use’ (emphasis added) is counted as work, activities classified as domestic duties or work for household use by the NSSO (codes 92 and 93) would need to be included as in Mondal et al. (2018). Using this expanded definition, if we construct an expanded Labour Force Participation Rate, the male LFPR in 2011-12 increases from 76.4 percent to 76.7 percent, but the FLFPR increases from 20.5 percent to 81.7 percent! This is because women comprise 99.4 percent of the workforce performing domestic duties or work for household use. Thus, once we take such unpaid work into account, women work much more than men. Four out of five (81%) of college educated women workers work in the service sector, while manufacturing employs 44% of women workers who only have school level education (NSS EUS 2011-12). 1 This is from the ILO model estimate for 15+ population in the World Development Indicators of the World Bank, 2018. 2 Derived from NSS 68th Round (2011-12) for males and females aged 15 years and above, and for both usual principal and subsidiary status. This assumes the additional female workers have the same productivity as the average worker. The increase is calculated using the provisional estimates for GDP at current prices at 167.7 trillion rupees for 2017-18. 64 65
THE STATE OF EMPLOYMENT IN INDIA 3 What Matters for Urban Women’s Work? 3.2 Existing explanations of low and declining FLFP 3.2.1.2 Change in Sectoral Composition the decline in FLFP among women with more education is highest in casual work (both farm and non-farm), even more than the decline in unpaid household work. Sanghi et al. (2015) also find that women no longer prefer to be working as helpers or casual labourers unless they are paid well.3 liberalization period (Mehrotra and Parida 2017). The rate of decline increased recently, and is more pronounced in rural than in urban areas (Desai et al. 2018). One argument is that this is the manifestation of a cross-country regularity, a U-shaped association between income and FLFP (Schultz 1990 & 1991, Kottis 1990, Goldin 1995). As the economy grows and women move out from agriculture and labour-intensive jobs, FLFP falls, rising eventually with higher education and better jobs. This strong decline in FLFP is evident when we compare illiterate women (high) to women who have secondary or higher secondary education (low), until it rises for women with college education (Chatterjee et al. 2018). For men, on the other hand, there is a steady increase in participation with education. Another is that women withdraw because sectors where work is available – agriculture and construction – where less educated women worked, are considered unsuitable once women become more educated. Per contra, even in a patriarchal society such as Bangladesh similar to India, higher FLFP can result from growth of wage employment in industries such as garments (World Bank 2012). So, another way to state this is that there is low demand for employment from such ‘suitable’ sectors. There has been much discussion of women’s work recently, but much of that has focused on why the low FLFP is declining further and relatively little attention has been paid to why it is low in the first place, especially in urban areas, where the latest (2015-16) official numbers (including subsidiary work) indicate urban FLFP of 16.6 percent and a female work force participation (FWFP) of 14.8 percent, with substantial variation across the country. One caveat to this is that many women report to be willing to work part-time, if it is ‘available at [their] household’. If all these women are counted, the FLFP would increase by 21 percentage points (Fletcher, et. al. 2017). 3.2.1.4 Occupational Segregation Worryingly, it is precisely such work that is on offer. Chatterjee et al. (2018) also find that much of female employment is concentrated in semi- skilled or unskilled jobs, while desirable ‘white collar’ urban employment is mostly undertaken by men. Even when described as ‘professionals, associate professionals, administrators and managers’, most such urban women workers are either own account or unpaid family workers (Raju 2013, Mondal et al. 2018).4 Two-thirds of urban female unpaid family workers are home based. In rural areas, even in the education and health sectors, with a greater presence of the public sector, women disproportionately occupy irregularly paid and informal jobs in the form of para-teachers, auxiliary midwives or AASHA workers. This reflects occupational segregation, that is, women are slotted into specific job roles. 3.2.1.5 Wage Discrimination Indeed, over the period 2011-12 to 2015-16, when there has been an absolute decline in manufacturing employment, the burden of adjustment has been disproportionately on women, as brought out in the accompanying case study, with the share of manufacturing in urban female workforce dropping from 28.5 percent to 21.5 percent, while the share in male workforce fell from 22.1 percent to 18 percent, which resulted in the share of women in manufacturing reducing from nearly a fourth to a fifth of the workforce. 3.2.1 Demand side explanations The explanations of low and declining FLFP in India focus around the helix of cultural constraints and low returns from work. Factors such as education, both self and husband’s, lack of skills, the competing responsibility of family care work, and social disapproval of working women are advanced as important cultural constraints of FLFP (Dasgupta et al. 2005, Kapsos et al. 2014). Concomitantly, issues of lower wages, low infrastructure provision, declining returns from agriculture and fragmentation of land and lack of ‘suitable work’ (Chaudhary & Verick 2014) reduce the returns from working. Depending on the viewpoint, the policy discourse also varies. Those privileging cultural explanations anticipate a slow change, while others argue that the solution lies in redressing structural constraints. This chapter tries to look a little deeper into this debate, to unpack viable interventions that could encourage more women to join the labour force. The first reason for falling FLFP is the decline in farm jobs, which has led to the withdrawal of females from labour force in rural and rapidly transforming urban areas (Kannan and Raveendran 2012, Chatterjee et al. 2015) and they have not been able to find other jobs suitable for them. This explanation encompasses many effects. Some of the major ones are described below: 3.2.1.3 Nature of Employment 3.2.1.1 Decreasing demand for farm work A related reason is that the nature of work on offer – non-regular/ non-salaried employment – is no longer compatible with higher levels of education. Women, especially after attaining a moderate level of education, are reluctant to accept casual work, especially out of the household. Chatterjee et al. (2018) find that One premise, valid more for rural areas, is that there is decreasing demand for farm work, especially casual farm work where women are overrepresented (Bardhan and Srivastava 2010), in part as a result of mechanization or a move away from the farm. It is unclear why this leads to a lower FLFP, instead of FWFP – that is, why women report themselves as out of the labour force, rather than unemployed, though some explanation can be found in their availability for part-time work at home (ibid). There is also wage discrimination, where similarly qualified women are paid less than men – a third less by some estimates International Labour Organization 2018) – for similar jobs. This is true across types of jobs. From the Fifth 1985, Srivastava 3 Women working as own account workers increased in lower consumption deciles, and unpaid helpers decreased in the higher deciles. While participation in casual public work rose between 2004-05 and 2011-12, it dropped across all decile classes for other casual work. FLFP has been falling relatively steadily since late 1970s in India, despite (or due to?) rapid economic growth, especially in the post- 4 This could be because they are mainly engaged within the self-help groups (SHG) and co-operatives as partners and have been recorded as directors or working proprietors, even as they are for the most part confined to food processing and textile and garment manufacturing (Mondal et al. 2018). 66 67
THE STATE OF EMPLOYMENT IN INDIA 3 What Matters for Urban Women’s Work? Annual Employment Survey, it can be seen that women are 1.9 to 2.4 times more likely to be in the bottom wage category as men.5 It is important to recognize that if reservation wages – the wage that will encourage a person to seek work – does not vary as much by gender, while market wages for women are much lower, fewer women will join the labour force. This is because they are discouraged by the inequality in wage offers, not because they voluntarily stay out of the labour force. This effect is likely to be more pronounced as more urban women become educated – indeed in many states a higher share of women possess college degrees than men. This issue is discussed in detail in the preceding chapter on wage inequality in this report. 48 percent to 55.7 percent in rural areas but only slightly from 66.7 percent to 67.3 percent in urban areas over in 1993-94 to 2011-12 (National Sample Survey Organization 1993-94, 2011-12, Ghai 2018). In this vein, MGNREGA is also a factor responsible for rural women’s withdrawal from labour force. Some (Mehrotra 2017) have argued that a MGNREGA-induced increase in rural real wages after 2004-05 fostered male employment, and the increased income encouraged their wives to drop out of the labour force. Other studies (Desai et al. 2018, Mondal et al. 2018, Sarkar, et al. 2019) argue that MGNREGA instead increased women’s participation in wage work in villages, especially where its implementation was strong. Since the wages for men and women are the same in this scheme, many families chose to have women participate in MGNREGA while men sought higher income elsewhere. women’s participation in market-oriented jobs at their spousal homes (Kaur 2004 & 2013).7 3.2.2.4 Changing nature of household domestic activities 3.2.2.1 Patriarchy Coupled with the decline in agricultural jobs, a shift in the nature of household domestic activities has caused a decline in the post marriage work of rural women (Mehrotra 2017). As children stop working and older girl children stay in school, domestic work activities such as child and elderly care and other duties such as collection of fuel, animal rearing, etc. devolve on older women, who were earlier working. Increase in the share of nuclear families in both rural and urban areas intensifies this effect. The contribution of this additional ‘reproductive labour’ (see Box 3.1), which actually increased at a higher rate than the purely domestic duties is largely ignored while determining work force participation, even though such labour is necessary for survival (Naidu and Rao 2018). Ghai (2018) directly confronts the issue of low levels of FLFP by constructing a measure of patriarchy using the NFHS 2015-16 data and finds that it has a positive and significant correlation with share of college educated who are out of the labour force. Interestingly, some southern states such as Telangana or Andhra Pradesh turn out to be as patriarchal as northern states such as Haryana and Bihar. 3.2.2.6 Infrastructure 3.2.1.6 Regulatory burden 3.2.2.2 Skill mismatch Other than the explanations above, lack of access to infrastructure, especially roads, is regarded as a major factor responsible for low rural FLFP. Empirical work using the IHDS surveys have shown that the construction of either a kutcha or a pucca road increases the odds of women’s participation in non-farm work by 1.5 and 1.4 times, respectively (Lei et al. 2017), which, given the expansion in rural roads under PMGSY (Prime Minister’s Gram Sadak Yojana or rural roads programme), should have led to higher FLFP. In urban areas, safe working environments for factory workers, childcare for informally employed women are forms of social infrastructure that can help in increasing FLFP (Sudarshan & Bhattacharya 2009). A number of states have specific regulations about workplace conditions for women which affect the incentive of employers to employ women. While these are advanced as a way to improve safety for women, they can also act as an employment dampener (Ghai 2018). Even in places where there is an increase in non- farm jobs in large cities, the skill level of female workers, who have been released from farm jobs are not aligned to the needs of such jobs.6 3.2.2.5 Income-effect of the household 3.2.2.3 Marriage-related relocation 3.2.2 Supply Side Explanations Increased household income leads to withdrawal of married women from the labour force (Abraham 2009, Srivastava and Srivastava 2010, Himanshu 2011, Sarkar et al. 2019, Chatterjee et al. 2018). This is exacerbated by the phenomenon (Behrman et al. 1995) where women usually marry more educated men. The consequent increase in income discourages the wife from joining the labour market. She is, instead, occupied in ‘status producing household work’ (Abraham 2009, Sarkar et al. 2019)8. This skill mismatch is exacerbated by the spatially hypergamous nature of marriage in India. The tendency to marry daughters away from their natal homes creates challenges for them to secure a job if they migrate to relatively developed spaces, especially from villages to cities. Studies dealing with long distance hypergamous marriages show how economic impediments such as low skills and cross-cultural hindrances have affected Women are studying instead of working. A common explanation is that more women are attending educational institutions, which is why they are not in the labour force. While it is true that proportionately more women are being educated, the share of women more than 15 years old who are Neither in Education nor in Employment or Training (NEET) rose from 5 While 36.4 percent, 17.9 percent and 7.9 percent of men earn less than 5000 rupees (bottom category), for casual work, contract work and regular salaried work respectively, the share of women in this category is 69.4percent, 43.65 and 19.2 percent respectively. 7 Empirical studies show higher drop-outs from labour force post marriage migrants for younger women (Banerjee and Raju 2009). The spatial nature of such phenomena is also interesting, where lower sex ratio leads to an importation of brides, moving from higher FLFP to lower FLFP states. 6 It is argued that the low skill and education level of women from poorer households in rural and urban areas makes them vulnerable to economic downturns, which is evident in cyclical fluctuation of female employment and higher incidence of temporary work in labour-intensive sectors (Mehrotra 2017). 8 Despite a decline in child marriage over time, the age of marriage for females is usually in early 20s in India (Desai and Andrist 2010). Hence, the unavailability of suitable work leads to an early marriage for a lot of educated women who do not prefer to do casual jobs post marriage. 68 69
THE STATE OF EMPLOYMENT IN INDIA 3 What Matters for Urban Women’s Work? 3.3 What Matters for Urban Women’s Work? 3.3.1 Choice of data matters Table 3.1 Measures of FWFP across Various Datasets Data-Type Rural Urban To begin with, it is useful to appreciate the variation in FWFP across India – that different parts of India have very different patterns of women’s work. Figure 3.1 shows the distribution of rural and urban FWFP across 640 districts of India from the Census of 2011. As one can see, the rural FWFP distribution has much wider range than the urban distribution – 93 districts have an urban FWFP of more than 30 percent while rural FWFP is above this level in 476 districts. Similarly, while 317 districts have a rural FWFP of more than 50 percent, only 7 districts have an urban FWFP above this level. All Workers ‘Full-Time’ ‘Full-Time’ All Workers Much of the discussion thus far has been on the decline of FLFP. We will now focus on the low levels of participation in the urban non-farm sector. The reason for this is that urban FLFP has been both low and stable, indicating a structural deficiency, as compared to rural FLFP. Furthermore, if it continues to be lower than its rural counterpart, the transformation from a rural farm to urban non-farm workforce will lead to a lower FLFP simply by the compositional effect. We also move from looking at FLFP to FWFP that is, from labour force to workforce participation, to disentangle industry related effects on women’s work. 46.23 Census 26.34 15.38 20.77 38.16 NSS EUS 27.79 16.38 19.95 41.44 IHDS-II 4.89 5.26 14.76 33.31 NFHS-IV 17.01 17.83 23.79 Source: Authors’ analysis from Census of India 2011, NSS EUS 2011-12, IHDS-II (2011-12) and NFHS-IV (2015-16) But, is this a robust description of variation across districts? To answer this question, we bring together four datasets, namely (a) the various Economic Tables (B-series) and Primary Census Abstract of Census of India 2011, (b) NSS Employment-Unemployment Survey 2011-12, (c) IHDS panel and IHDS-II survey of 2011-12, and (d) NFHS-IV survey of 2015-16, each of whom have different definitions of work.9 In order to compare FWFP estimates across the four datasets, we focus on two categories of work: a stringent ‘Full-time’ work (see Table 3.1), and Total work, including ‘Part-time’ work, which measures work done other than or in addition to full-time work. We then calculate district wise FWFP for 367 districts for two measures of each of these four datasets and correlate them to each other.10 What we find is that the one measure does not match the other, but it is low regardless of the measure used. The correlations, as shown in Figure 3.3 and Figure 4.4 shows that the spatial pattern of FWFP, that is, which district is seen as having relatively higher FWFP and which is seen as relatively lower FWFP would vary depending on which dataset is used. If the districts in the highest 25 percent (that is, 91 districts) for each of the datasets are considered, only 15 (27) common units show in case of Full Time-Rural (all Rural) workers, and 12 (13) units in case of Full Time- Urban (all urban) workers, indicating that there is considerable divergence of measurement even at the top end of the distribution. Depending on the data, urban FWPR (all work) can vary from 14.8 percent (IHDS-II) to 23.8 percent (NFHS IV). We need to measure female workforce participation better. FigURE 3.1. Rural-Urban Distribution of FWFP FigURE 3.2. Spatial Distribution of Urban FWFP (All Ages) Ü .08 0 140 280 560 840 1,120 Kilometers .06 .04 .02 Urban FWFP 0 Less than 15% 15%-20% 0 20 40 60 80 FWFP (%) 20%-25% Rural Urban More than 25% Data Not Available 9 The whole exercise is restricted to women aged 15-49 years, in order to make it compatible with NFHS-IV. Source: Authors’ analysis from Census 2011 Source: Authors’ analysis from Census 2011 10 Both census 2011 and NFHS-IV covers all the 640 districts of India during 2011. NSS 2011-12 covers 625 districts existed within 2001-11. IHDS- II used the reference of census 2001 but it covered only 372 geographical units where some districts were aggregated as a single unit, mostly in the Northeast of India. We use IHDS as a baseline and the districts from the three other datasets were adjusted as per boundary changes to form 367 unique geographical units. These 367 geographical units covers 454 out of 640 Indian districts during Census 2011. Though technically they are units, we will continue to refer to them as districts for ease of understanding. 70 71
THE STATE OF EMPLOYMENT IN INDIA 3 What Matters for Urban Women’s Work? FigURE 3.3 Correlation of Full-Time Workers Box 3.2: Does Religion Matter? 0.8 0.74 15 0.7 0.59 Hindu > Muslim 0.58 10 8.6 0.6 Difference between share of Hindu and Muslim 0.51 5.4 0.42 0.5 0.40 workers in different sectors 5 0.37 2.6 2.4 1.8 0.32 0.4 0.5 0.3 0.2 0.2 0.28 0.26 0 0.11 0.3 0.18 -3.9 -5 0.1 -5.5 Muslim > Hindu 0 -10 NSS-Census Census-NFHS IHDS-Census NSS-NHFS IHDS-NSS IHDS-NFHS Urban Rural -12.9 -15 Finance, Real Estate Electricity, Gas and Water Transport & Storage Manufacturing (HHI) Manufacturing (NHHI) Construction Hotels and Restaurants ICT Administrative Services Education & Health Other Services Retail Trade & Business Supply FigURE 3.4 Correlation of All Workers 0.8 0.67 0.66 0.7 While there is a lot of variation across districts, there does not seem to be a systematic difference in FWFP between Hindus and Muslims. Broadly, if proportionately more Hindu women work in a district, Muslim women are also more likely to work in that district. However, the industries of work differ. According to the Census 2011, Muslim women are more likely to work in manufacturing (disproportionately as unpaid workers in family enterprises), while Hindus are more likely to work in public and social services (as wage workers). Though the urban national Muslim FWFP (12.5 percent) is lower than the Hindu FWFP (18.2 percent), urban Muslim female workers are concentrated in certain districts. A closer look reveals that where urban Muslim FWFP is high and more than Hindu FWFP (more precisely, 128 districts consisting of 23 percent of Muslim female workers), 47.4 percent of them are engaged in household manufacturing, as compared to only 12.5 percent in other districts – indicating that the outlier districts with high Muslim FWFP have a specific industrial structure. It is also possible that there are cultural reasons for the low participation of Muslim women in public and social services. 50.0% 0.6 0.52 0.50 0.50 40.0% 0.5 0.41 30.0% 0.37 Muslim FWPR 0.33 0.32 0.4 0.25 20.0% 0.3 0.14 10.0% 0.11 0.1 0.0% 0.0% 10.0% 20.0% 30.0% 40.0% 50.0% 0 Hindu FWPR NSS-Census Census-NFHS IHDS-Census NSS-NHFS IHDS-NSS IHDS-NFHS Urban Rural Source: Authors’ analysis using various data sources Note: All Correlation coefficients are statistically significant at 5% level, except the IHDS-NFHS pair in urban areas 72 73
THE STATE OF EMPLOYMENT IN INDIA 3 What Matters for Urban Women’s Work? FigURE 3.5 Distribution of different FWFP estimates across various settlements (15-59 yrs.) Box 3.3: Manufacturing or Services: Where is the potential for women’s work? 60 54.2 12.8 15 11.7 Difference between Share of Male and Female Workers in Different Sectors 50 10 45.4 7.3 5.0 5 40 34.9 0 30.2 -0.2 -0.6 -0.6 29.4 30 -5 25.5 23.0 21.9 -7.3 -10 -8.5 19.4 18.2 17.1 20 15.4 -15 -14.0 Trade Electricity, Gas and Labour Intensive Other Construction Transport Services Agriculture Mining Domestic Work Water Supply Manufacturing Manufacturing 10 0 Million Plus 0.1 mn - 1 mn Less than 0.1 mn Villages Source: Authors’ analysis from NSS EUS 2011-12 Main Main+Marginal Labour Force While there is a substantial difference between men and women in terms of workforce participation, the difference in the sectors of work is more mixed. The figure above shows the difference between the sectoral share of men and women, that is the share of construction workers in the male workforce is 7.3 percent higher than the share of construction workers in the female workforce. Thus, women have a much higher share of their workforce in labour intensive manufacturing, services and domestic work, while men dominate in construction, transport and trade. Thus, it would appear that there are both manufacturing as well as service-based strategies are feasible pathways to increasing FWPR. Source: Author’s analysis from Census 2011 associated with subsidiary work in such areas compared to larger cities, a pattern that also emerges in other studies that look at location effects on FWFP (Chatterjee et al. 2015). This is very different from the males where the difference is stable across the various settlements. The smaller towns (villages are shown for comparison) also show larger proportion of women seeking jobs, as the FLFP goes up from 30.2 percent in million plus cities to 34.9 percent in small towns, as per Census 2011 (FLFP in mid-size towns is similar to large cities). So, location matters and women in smaller towns participate proportionately more in the workforce than those in larger cities. Is this another case of the income effect or is it a case of more flexible labour markets? 3.3.2 Location matters 3.3.3 Industrial Structure matters In order to check the effects of a district’s job structure on FWFP, a measure is constructed which quantifies the share of all workers in ten industries (see Table 3.2). These ten industries have the highest share of women workers (to total women workers) and thus count as ‘female friendly’. We then look at the relationship between the urban FWFP and the intensity of presence of these ten industries in a district.11 Does FWFP increase with a rise in the share of such female friendly industries in a district? The overall urban FWFP is lower (20.8 percent as per Census 2011) than rural FWFP, but the spatial distribution of urban FWFP also has substantial regional variation, with districts of southern and NE states showing considerably higher participation than the rest of the country. A disaggregation of urban FWFP across cities of various size-classes (Figure 3.5) shows that women’s participation in work is lower in million plus cities compared to smaller urban areas. The difference between main and marginal work is also much higher in small towns than the larger ones, indicating that a lot more women are Women’s specific regions and in specific industries (Box 3.3) compared to men’s work. A common explanation for low FWFP is a dearth of suitable job opportunities where women choose to work, taking into account the wider social structure in the country that determines that women’s place of work should be near to where they live (Das & Desai 2003, Klasen & Pieters 2015). So, do more women join the workforce where the share of ‘female friendly’ industry is high? work is more concentrated in 11 Statistically, the urban FWFP is regressed on this measure, controlled by the district’s urbanization rate and state-specific fixed effects. 74 75
THE STATE OF EMPLOYMENT IN INDIA 3 What Matters for Urban Women’s Work? 3.3.4 Caste Matters Table 3.2 Top ten industries of URBAN Women’s work by the industrial structure of the district. The yellow shaded areas are districts where the model describes the variation in urban FWFP relatively well while areas with orange shades are districts where the actual urban FWFP is higher than predicted by the industrial structure of the district. There are 284 yellow-shaded districts out of 640, which indicates that in a large part of the country, after controlling for the regional structure and urbanization, the industrial structure actually determines the participation of women in work. In most other areas, the urban FWFP is higher than predicted by the industrial structure of the district. NIC Name Urban Females (in millions) Share in workforce (%) Urban Males (in millions) Share of Females (%) NIC Div. The urban FWFP of Scheduled Castes (21.1 percent) are higher than non-SC/STs (16.5 percent) but it shows a strong and positive correlation with non SC- ST women, indicating that districts that have higher workforce participation of non SC-ST women, usually have higher participation of SC women as well.12 However, the industries in which they work are very different, with SCs concentrating in construction and services such as waste collection while the non- SC/ST women are more likely to work in education and health services. Even within industries such 85 Education 3.3 13.2% 3.1 50.9% 47 Retail trade, except for motor vehicles and motorcycles 1.5 6.1% 15.5 8.9% 14 Manufacture of wearing apparel 1.2 4.9% 2.6 31.9% 86 Human health activities 1.2 4.8% 1.3 47.5% 97 Activities of households as employers of domestic personnel 1.2 4.7% 0.3 80.9% 96 Other personal service activities 1.1 4.3% 1.5 42.0% 13 Manufacture of textiles 1.0 4.0% 3.3 23.0% 41 Construction of buildings 0.9 3.8% 6.7 12.3% FigURE 3.6 Share of Top Ten Industries and Predicted FWFP FigURE 3.7 Where the model fits well and where it doesn’t 12 Manufacture of tobacco products 0.9 3.7% 0.3 77.5% 84 Public administration and defence; compulsory social security 0.9 3.5% 5.7 13.2% Ü 13.1 53.1% 40.2 24.6% Total of top ten sectors .24 0 140 280 560 840 1,120 Kilometers FWFP=0.15-0.30x+0.38x2+0.06z+... Adj. R2=0.5477 24.7 100% 97.4 100% Total Urban Non-Farm Workforce .22 Predicted Values of Urban FWFP Source: Authors’ analysis from Census of India 2011 .2 .18 The results from the analysis show that industrial structure of the district matters substantially, though not entirely in explaining the variation in urban FWFP. The predicted urban FWFP shows that the relationship is weak when the share of top ten industries is low, but increases with it after the share of top industries crosses a threshold (Figure 3.6) and the variation in this measure explains 55 percent of the variation in urban FWFP across all districts. The FWFP however remains low even in districts with a large share of female friendly industries, below 20 percent. In the top ten percent of the districts ranked by presence of the ten female-friendly industries, the FWFP is about 21.7 percent compared to other districts, where it is only 14.9 percent. Similarly, their share in the labour force in these districts is 27.7 percent compared to 19.7 percent in other districts. So, in the presence of such industries, the increase in participation also results in higher share of the total labour force. Per contra, for men, there is no appreciable difference in work force participation rate across these two groups of districts. .16 < -2.5 Std. Dev. -2.5 - -1.5 Std. Dev. .14 -1.5 - -0.50 Std. Dev. -0.50 - 0.50 Std. Dev. 0.50 - 1.5 Std. Dev. .2 .4 .6 .8 Share of Workforce in Top Ten Industries 1.5 - 2.5 Std. Dev. > 2.5 Std. Dev. Data Not Available Source: Authors’ analysis from Census 2011 In the accompanying map (Figure 3.7), the shades of blue refers to districts where fewer women are actually working than is predicted 12 In case of males, the urban workforce participation of non-SC/STs (61.1 percent) is higher than that of SCs (59.9 percent). ST women (27.7 percent) also work more than non-SC/ST women in urban areas, while the case of males is different. The correlation coefficient of SC and Non-SC/ ST women is 0.61, while the rank correlation is even stronger (0.71). 76 77
THE STATE OF EMPLOYMENT IN INDIA 3 What Matters for Urban Women’s Work? FigURE 3.9 Occupational Classification of Workers by Social Groups in Construction as construction where SCs are relatively more concentrated (Figure 3.8), they are engaged in more menial jobs than the non-SC/STs in the same sector (Figure 3.9). For example, there are no SC women in the NSS sample who are in supervisory, professional or managerial jobs in construction, while about 15 percent of non-SC/STs in construction are engaged in such jobs. On the other hand, the share of SCs (67 percent) is much higher in elementary occupations under construction, while it is only 34 percent for non-SC/STs. 72 80 67 Thus, caste matters both for participation and for occupation. Being non-SC/ST does appear to reduce the participation of women in the workforce – in part because they are less present in more menial occupations. Percentage to Total Workers in Construction 70 60 53 50 46 38 40 34 32 30 27 20 FigURE 3.8 Difference in share of Workers by Industry (SC and Non-SC/ST) 15 10 7 5 7.6% 0 1 1 1 8 7 6 5 4 3 2 1 0 0 0 0 0 0 0 Non-SC/ST > SC Owners and Managers Professionals Crafts & Trades Workers Elementary Workers Others Difference between share of SC and Non-SC/ST ST SC OBC Others workers in Different Sectors 2.1% Source: Authors’ analysis from NSS EUS 2011-12 1.7% 1.6% 1.3% 3.4 Interaction of gender and caste and men are significantly overrepresented in cleaning work. While 30 percent of SC women (and 22 percent of men) working in the health sector are employed in cleaning work (as compared to single digit shares for other castes), there are very few doctors (2 percent) among SC women and only a little more (4 percent) among SC men. There is, however, a significant share (56 percent) of SC women working as nurses or technicians. -1 -2 -3 -4 -5 -6 -7 -2.1% While the industrial structure and occupational patterns are differentiated by caste in women’s work, is there an effect of gender within caste, especially in industries such as education or health where women from most social groups are represented? We have already seen that there are clear differences by caste with the non-SC/ST being concentrated in health and education, but when we look within education, we find that both SC men and women tend to do similar kinds of jobs. Both of them have significant presence in teaching, but their presence in housekeeping and unskilled work is disproportionately higher than in other castes (Figure 3.10 and 3.11). -5.2% SC > Non-SC/ST -6.4% Administrative Education and Manufacturing Finance, Real Estate & Construction Manufacturing (HHI) ICT Other Services Services Health (Non-HHI) Business However, in the case of OBCs, while only 6 percent of the women are doctors and 68 percent are nurses or technicians, among OBC men 32 percent are doctors, which is less than upper caste men (48 percent), but much higher than SC men. Hence, the share of doctors among OBC women remains low and comparable to SC men, OBC men are catching up with upper caste men, referring to a narrowing caste divide but persistent gender divide within the OBCs (Figure 3.12 and 3.13 ). Source: Authors’ analysis from Census 2011 However, in the case of health, there is evidence of difference across both caste and gender. SC women 78 79
THE STATE OF EMPLOYMENT IN INDIA 3 What Matters for Urban Women’s Work? FigURE 3.10 Education (Females) FIGURE 3.12 Health (Females) 60 60 55 54 50 50 Percentage to Total Female Workers in Education Percentage to Total Female Workers in Health 42 42 42 42 39 58 40 40 36 34 30 30 30 20 20 16 17 14 13 11 10 7 7 10 10 6 6 5 5 5 3 3 3 1 1 2 2 2 2 0 0 0 0 0 0 0 0 Owners & Managers Secondary & College Teachers Primary & Middle School Teachers SC Clerks Housekeeping Unskilled Others Owners & Managers Nurses Doctors Technicians Cleaners Others OBC Forward Caste SC OBC Forward Caste FIGURE 3.13 Health (Males) FigURE 3.11 Education (Males) 60 60 55 51 48 50 50 Percentage to Total Male Workers in Education 44 Percentage to Total Male Workers in Health 39 40 40 35 33 32 31 30 30 26 26 25 25 22 20 20 14 10 7 10 10 6 5 5 5 5 4 5 5 4 3 3 3 3 3 3 3 2 2 2 2 2 2 0 0 Owners & Managers Secondary & College Teachers Primary & Middle School Teachers SC Clerks Housekeeping Unskilled Others Owners & Managers Nurses Doctors Technicians Cleaners Others OBC Forward Caste SC OBC Forward Caste Source: Authors’ analysis from NSS EUS 2011-12 Source: Authors’ analysis from NSS EUS 2011-12 80 81
THE STATE OF EMPLOYMENT IN INDIA 3 What Matters for Urban Women’s Work? These intersections of gender and caste at different levels show that the manner in which caste affects women’s work is layered and complicated and not amenable to simple solutions. limited, though proportion of women in self- employment (as a share of women in the workforce) drops sharply for the top 20 percent of the households. In contrast, the share of women in unpaid work in household enterprises and casual work drop steadily as economic condition improves, with casual work decreasing faster than unpaid work at home. Women also have a higher incidence of home based work (25 percent compared to 10 percent for men, based on NSS 2011-12), which can lower income (see the chapter on unpaid care work for a more detailed discussion).13 Finally, as expected, increase in the share of women in regular salaried/wage work (as a share of women in the workforce) is associated with improved economic condition. In this, the possibility of reverse causality, that is, an improvement in economic condition because someone finds regular salaried work, cannot be ruled out. FIGURE 3.14 FWFP by Consumption Quintiles FIGURE 3.15 Share of Self-employed women by Consumption Quintiles 20 35 3.4.1 Income Matters Percentage of Total Workforce 30 It is difficult to decipher whether income matters from the data, since the presence of a working woman in the household would raise the household’s income and thus higher income households would be associated with a higher share of working women. However, Sarkar et al. (2019), using careful statistical techniques to analyse the IHDS data finds that an increase in income of other members of the household and change in the asset ownership of a household lowers a woman’s probability of entry into and increases the probability of exit from the workforce overall, but not so clearly in urban areas, where it is affected by change in assets but not in income. 25 15 20 15 10 1 2 3 4 5 6 7 8 9 10 1 2 3 4 5 6 7 8 9 10 MPCE Decile MPCE Decile WFPR Self Employed 3.4.2 Education and Family Structure Matters FIGURE 3.16 Share of Unpaid family workers and Casual Workers by Consumption Quintiles FIGURE 3.17 Share of Salaried Women by Consumption Quintiles So, while there does seem to be indirect indications of a negative income effect on women’s work, this is not so clearly evident when it comes to urban areas. In this section, we look at the effect of education and family structure on the work of married women aged 15-49. We focus on married women because married women constitute about 65 percent of the urban female workforce within 15-49 years and this allows us to investigate the interactions between husband’s work and education and the women’s propensity to work. The workforce structure of married women differs from the total women workforce in urban areas, for example, the share of salaried workers among married women is lower (35.8 percent) than total women (47.4 percent). 35 80 30 70 Percentage of Total Workforce 25 60 However, the pattern of employment is very different across consumption quintiles. Figure 3.14 shows that the urban FWFP varies irregularly within a range of 13 percent to 16 percent across household consumption quintiles. However, this overall variation masks significant changes in the structure of work, as shown in other panels (Figure 3.14-3.17). As households’ economic condition improves, the effect on self-employment is 20 50 15 40 10 30 5 20 0 10 1 2 3 4 5 6 7 8 9 10 1 2 3 4 5 6 7 8 9 10 MPCE Decile MPCE Decile Unpaid family worker Casual wage labour Regular salaried/Wage employee 13 In a study on industrial areas in Delhi by Sumangala Damodaran, Sonal Sharma and Eesha Kunduri, 77 female workers (24 home-based workers and 53 factory workers) were surveyed in 2013-14. Their median monthly earnings (not wages) was 1400 rupees, ranging from a minimum of 200 to a maximum of 3000 rupees, for home-based workers compared to 4000 rupees for factory workers, ranging between 3000 to 5000 rupees (private communication from Eesha Kunduri). Source: Authors’ analysis from NSS EUS 2011-12 82 83
THE STATE OF EMPLOYMENT IN INDIA 3 What Matters for Urban Women’s Work? FIGURE 3.18 Industry of work by education of married women Box 3.4: Costs and Benefits of Multiple employers: Domestic work in India 100 According to the Census, domestic work ranks fifth among the occupations employing women, accounting for 4.7 percent of the work force. Also, women comprise over 80 percent of the workers in this sector. Many of these workers are employed in multiple households (Neetha 2019, Neetha and Palriwala 2011). In their sample of 500 workers in Kolkata, Qayum and Ray (2003) found that 77 percent of the workers were part-timers. In the IHDS-II data also, 60 percent of domestic workers are part-time. While this work is ‘part-time’ from the employers’ point of view, implying that each worker spends limited time in each household. For the workers, however, the total number of hours spent in multiple households could amount to a full working day or even more (Neetha and Palriwala 2011). Such ‘part-time work is both more unstable and more flexible.’ Neetha and Palriwala (2011: 108). It carries the risk of arbitrary dismal and unlike older arrangements for family retainers, no living arrangements are provided (Neetha 2019). Employers prefer the arrangement because it allows them to hire multiple workers for various needs, such as cooking, cleaning, childcare, etc. (Neetha 2019). From the workers’ perspective too, part-time domestic work grants relatively greater autonomy, bargaining power and flexibility (Ray and Qayum 2010; Neetha and Palriwala 2011). For example, workers can return to their homes within the day to take care of domestic responsibilities, particularly childcare (Neetha and Palriwala 2011) . Workers are not tied to a single employer, and ‘no one employer can hope to command their full attention and loyalty’ (Qayum and Ray 2003: 533). 81 Percentage to Total Women Workers in 80 each Educational Categories 60 48 44 42 37 40 32 25 20 20 20 20 17 20 13 11 11 10 9 10 7 7 6 5 5 2 1 0 Illiterate Primary Secondary Higher Secondary Gradutate & Higher Manufacturing Trade Services Domestic Work Others Source: Authors’ analysis from NSS EUS 2011-12 FIGURE 3.19 FWFP by Husband’s Education 35 32.4 3.5 Relationship with education of husband In urban areas, manufacturing, services, trade and domestic work (see Box 3.4) comprise 81 percent of the married women workforce. Within these four key sectors, increasing education leads to a change in industrial composition of work. For example, only 20 percent women with secondary schooling are employed in services but this share increases to 81 percent for women with graduate degrees (Figure 3.18 ). The opposite relationship can be observed for labour intensive manufacturing work, where the share of less educated women is higher. 29.6 29.6 28.7 30 27.6 27.6 26.3 24.8 25 The education level of the wife in relation to the husband matters. Increased education of married women in comparison to their husbands leads to an increase in work force participation. While higher education women increases their likelihood of being in salaried jobs, the share of such jobs in the total work of women is even higher if women are more educated than their husbands. On the other hand, if the husbands are more educated than wives, then the wife is more likely to own a business or work as an unpaid family worker (Figure 3.19 and 3.20 ) – two-thirds of whom are home-based. 21.2 20.7 20.4 20 FWFP (%) 15.9 15 11.7 9.7 10 5 0 0 Illiterate Primary Secondary Higher Secondary Graduate & Higher Husband More Same Education Wife More Source: Authors’ analysis from NSS EUS 2011-12 84 85
THE STATE OF EMPLOYMENT IN INDIA 3 What Matters for Urban Women’s Work? Table 3.3 Association between married women and their husband’s Industry of work FIGURE 3.20 Nature of Work by Husband’s Education HUsBAND 50 A B C D E F G H I J TOTAL RATIO 44.5 WIFE A 75% 20% 4% 4% 6% 13% 4% 6% 4% 2% 12.1% 6 37.8 40 Percentage to Total Female Workers in B 0% 31% 0% 0% 0% 0% 0% 0% 0% 0% 0.2% .. 32.7 C 12% 12% 76% 27% 14% 19% 18% 29% 13% 3% 26.0% 3 each Educational Group 29.2 28.5 30 D 0% 0% 3% 33% 0% 4% 3% 4% 3% 1% 5.4% 6 24.1 23.1 19.8 E 0% 12% 0% 1% 41% 1% 0% 1% 1% 0% 1.1% 36 17.4 20 15.0 14.8 F 1% 0% 1% 0% 1% 31% 2% 2% 1% 1% 5.4% 6 11.9 G 4% 8% 3% 5% 4% 6% 44% 10% 5% 6% 13.3% 3 10 H 0% 0% 0% 1% 0% 0% 0% 2% 0% 0% 0.4% 5 I 6% 11% 9% 26% 33% 14% 15% 30% 69% 34% 27.6% 3 0 Own Account Worker Unpaid Family Labour Casual Labour Salaried Worker J 1% 6% 3% 4% 0% 11% 13% 16% 5% 54% 8.5% 6 Husband More Same Education Wife More Total 100% 100% 100% 100% 100% 100% 100% 100% 100% 100% 100% Source: Authors’ analysis from NSS EUS 2011-12 Source: Authors’ analysis from NSS EUS 2011-12 Note- A: Agriculature, B: Mining, C: Labour Intensive Manufacturing, D: Other Manufacturing, E: Electricity, Gas & Water Supply, F: Construction, G: Trade, H: Transport, I: Services, J: Domestic Work *Ratio refers to ratio of the share of women in same sector as their husbands to share of sector to total women workforce 3.6 Relationship with husband’s industry of work workforce14. In the case of most of the sectors, women who do not work in their husband’s sector are mainly distributed in labour intensive manufacturing and services, and if these three are added, it constitutes over 80 percent to 90 percent of working women across various sectors of working men. It can be observed that only wives of transport and construction workers have a somewhat more diversified job profile, and are not concentrated in these three sectors. However, the share of women working in transport sector is only 0.4 percent of the total urban female workforce.15 The nature of work undertaken by married women also depends largely on the industry where the husband works. Working wives are more likely to be unpaid workers in the family business in case the husband works in labour intensive manufacturing near home or in a trade or service business. However, in case of trade, if the husband does not own the trade business but works as a salaried wage worker then the wife can also be a wage worker or can run a small business herself. Similarly, if the husband works as a wage worker in the service sector, the wife is more likely to be a wage worker in the same sector (Figure 3.21 ). Thus, not only does education of the woman matter, it also matters how it interacts with the education of their husband. Furthermore, women are much more likely to be in the same industry as their husbands. The nature and industry of jobs where married women are engaged in urban areas depends a lot on their husbands’ industry of work. Urban married women are much more likely to work in the same sector as their husbands (Table 3.3), and the share of women working in their husband’s sector to total women in that sector is usually 3-6 times of the share of that sector to total women 3.6.1 Children Matter Finally, we look at the effect of children on FWFP. Given the nature of survey data, it is not easy to check the effect of children on women’s workforce participation. We approach this in two ways: the first one is through an indirect measure in which the urban households surveyed by the NSS is divided into two groups: households 14 We do not present this ratio for mining and electricity, gas and water supply, where there are very few women workers. 15 Age-specific estimates, available on request show that older wives are less likely to be working with husbands in manufacturing, while younger wives are more likely to be working in the same sector of their husbands, if the husbands are engaged in services. 86 87
THE STATE OF EMPLOYMENT IN INDIA 3 What Matters for Urban Women’s Work? FIGURE 3.21 FWFP of Married Women and Nature of work of wives by Industry of Work of Husband taken as a separate group because they are most likely the children of women who have given birth to a child between the previous and recent round of IHDS. However, unlike NSS, the IHDS results does not show any change in overall FWFP across the women who has such a child, but there is a small tendency to shift from full-time work to more part-time or occasional work for those women, and more so for women who have a child aged 0-6 years and have probably given birth over the survey interval (Figure 3.23). However, at this stage, empirical studies, such as Sarkar, et al. 2019, seem to indicate that the presence of an older family member does not lead to a statistically significant drop in FWFP. This could be because such family members could take over child care duties, which partially counteracts the effort involved in caring for them. This issue is discussed in more detail in the chapter on unpaid care work. Also, as the accompanying case study shows, women may choose to stay at home to supervise the upbringing of older school-going children, beyond the usual age of child care provision. 40 35 10 5 30 4 3 25 6 10 FWFP (%) 20 1 2 3 24 18 2 1 15 10 9 4 7 10 Care work for other family members also plays a role in determining whether a woman will work. 9 10 7 3 2 5 6 3 1 2 5 9 3 3 8 7 6 6 5 5 5 0 A B C D E F G H I J Self Employed Unfair family labour Salaried Employee Casual Labour FIGURE 3.22 Urban FWFP by Type of Household in terms of children and Marital status Source: Authors’ analysis from NSS EUS 2011-12 Note: A: Agriculture, B: Mining, C: Labour Intensive Manufacturing, D: Other Manufacturing, E: Electricity, Gas & Water Supply, F: Construction, G: Trade, H: Transport, I: Services, J: Domestic Work 80 70 62 60 48 47 50 with at least one child below 5 years of age and all other households. Across these two kind of households, the difference in workforce participation of married and unmarried women (aged 25-44 years) are compared. The share of unmarried women living in a household with a child is 0.8 percent to total urban women in the selected age-group, and the share of married women in such households is 58.8 percent. In households without such a child, the share of unmarried women is 4.9 percent to total urban women, while it is 35.5 percent in case of married women. women in those households (Figure 3.22). The workforce participation of married women in households with a child is the least, followed by married women in households without a child, and thereafter (younger) unmarried women in households with a child and unmarried women in household without a child. This is suggestive of the dual burden of marriage and childbearing on workforce participation. 44 FWFP (%) 36 40 30 29 29 28 28 30 25 24 24 24 17 17 20 10 0 25-29 30-34 35-39 40-44 Unlike the NSS which does not allow to map every child in the household with its mother, IHDS-II survey allows an exact match of the mother and child. Hence, a more direct approach is taken to ask whether workforce participation is affected if any woman has a child below 6 years, and between 7 to 14 years. The 0-6 years children are Married in Household with small child Married in Household without small child Unmarried in Household with small child Unmarried in Household without small child Results show that women are more likely to work in households that do not have a child, and such likelihood is more for unmarried Source: Authors’ analysis from NSS EUS 2011-12 88 89