Download
1 / 12
120 likes | 132 Views
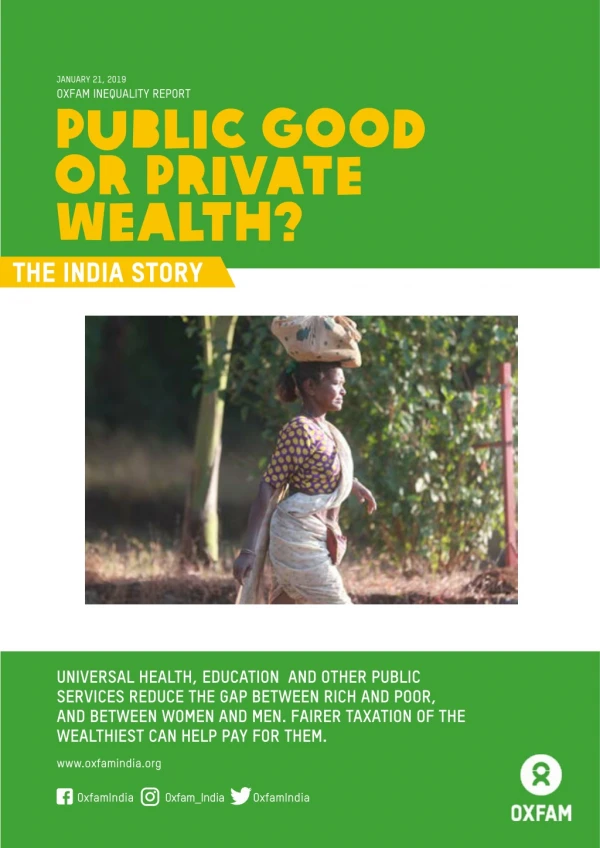
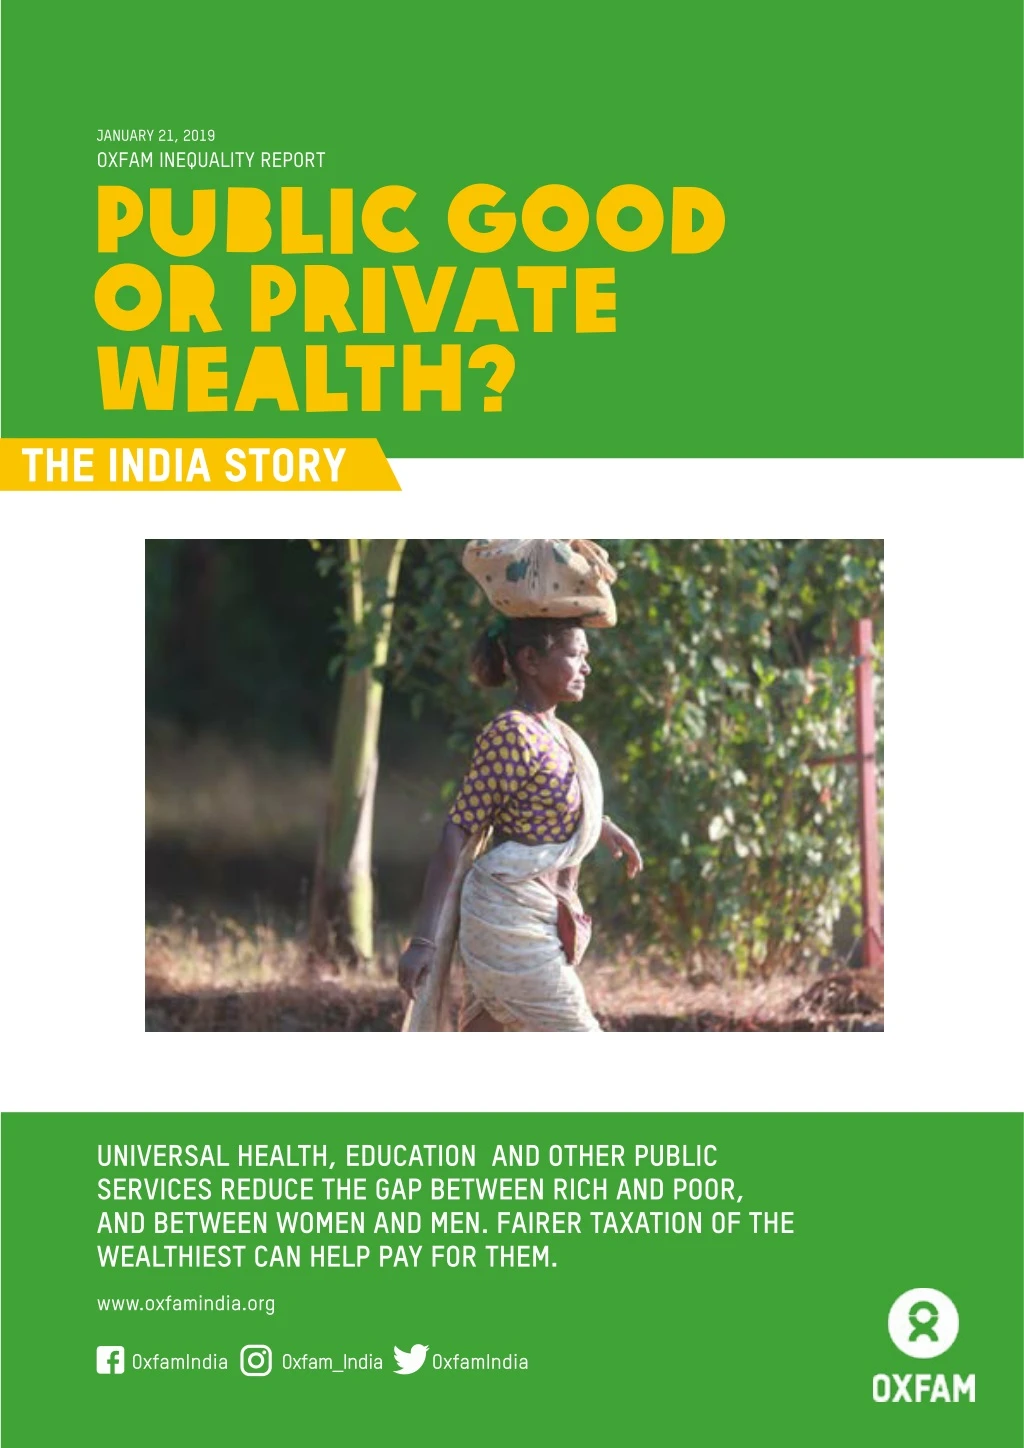
Universal health, education and other public services reduce the gap between rich and poor, and between women and men. fairer taxation of the wealthiest can help pay for them.

E N D
OXFAM INEQUALITY REPORT 2019 JANUARY 21, 2019 OXFAM INEQUALITY REPORT Public Good or Private Wealth? The India Story UNIVERSAL HEALTH, EDUCATION AND OTHER PUBLIC SERVICES REDUCE THE GAP BETWEEN RICH AND POOR, AND BETWEEN WOMEN AND MEN. FAIRER TAXATION OF THE WEALTHIEST CAN HELP PAY FOR THEM. www.oxfamindia.org OxfamIndia Oxfam_India OxfamIndia
OXFAM INEQUALITY REPORT 2019 GLOBAL INEQUALITY ON THE RISE Analysis of billionaire wealth shows that as of 2018, there are 15 billionaires from the consumer goods industry and 15 billionaires from the pharmaceuticals industry3—a rarity among developing countries. If we look in terms of gender equality among Indian billionaires, the picture is dismal. There are only nine women billionaires in the list, constituting just 7.5% of the Indian billionaires. Thus ‘Billionaires Boys Club’ is not a myth. The Davos report 2019 “Public Good or Private Wealth?” shows that our economic system is broken, with hundreds of millions of people living in poverty, while huge rewards go to those at the very top. In the 10 years since the global financial crisis, the number of billionaires has nearly doubled. In the past year, a new billionaire was created every two days and a total of 2208 billionaires worldwide in 2018. The wealth of the world’s 1,900 billionaires increased by US$900 billion (INR 63000 billion) in the last year alone, or US$2.5 billion1 (INR 175 billion) a day. Meanwhile the wealth of the poorest half of humanity, 3.8 billion people, fell by 11%. Wealth is becoming even more concentrated – in 2018, 26 people now own the same as the 3.8 billion people who make up the poorest half of humanity, down from 44 people last year. The world’s richest man, Jeff Bezos, owner of Amazon, saw his fortune increase to US$112 billion (INR 7840 billion). Just 1% of his fortune is the equivalent to the whole health budget for Ethiopia, a country of 115 million people. Between 2018 and 2022, India is estimated to produce 70 new dollar millionaires every day.4 India’s top 10% of the population holds 77.4% of the total national wealth. The contrast is even sharper for the top 1% that holds 51.53% of the national wealth. The bottom 60%, the majority of the population, own merely 4.8% of the national wealth. Wealth of top 9 billionaires is equivalent to the wealth of the bottom 50% of the population. High levels of wealth disparity subverts democracy. While the gap between the rich and poor remains unsustainably high, some groups have had a particularly rough deal. A proper understanding of inequality must allow us to understand the overall trajectory of the economy as well as the way how income is distributed among the various population groups. INEQUALITY AFFECTS INDIA TOO: BOOM TIME FOR INDIAN BILLIONAIRES Similarly, in India, wealth inequality is on the rise. The Gini wealth coefficient in India has gone up from 81.2% in 2008 to 85.4% in 2018, which shows inequality has risen. Rising inequality threatens the social fabric of the nation. Inequitable growth provides fuel for social unrest and rising crime.In the last 12 months, total wealth of India has increased by US$151 billion (INR 10591 billion). Wealth of top 1% increased by 39% whereas wealth of bottom 50% increased a dismal 3%.2 Different social groups have different trajectories and inequalities persist between different states and urban and rural India. This gap between the rich and the poor, and the gap between men and women can be closed by investing in universal free public services and social protection for all. This Report builds a strong case for the above. In India, billionaire fortune grew by INR 22 billion (US$0.31 billion) a day in 2018 while the poorest decile remains in debt since 2004. India added 18 new billionaires in the last year raising the total number of billionaires to 119. Their wealth crossed the US$400 billion (INR 28000 billion) mark for the first time. It rose from US$325.5 billion (INR 22725 billion) in 2017 to US$440.1 billion (INR 30807 billion) in 2018. This is the single largest annual increase since the 2008 Global Financial Crisis. The total wealth of Indian billionaires is higher than the total Union Budget of India for the fiscal year 2018-19 which was at INR 24422 billion. In the last 12 months, the total wealth of 119 Indian billionaires increased by INR 80.2 billion (US$114.6 billion). This amount is equivalent to the combined (Centre and States) direct tax revenue (INR 86.2 billion in 2016-17) of the country. INEQUALITY IN INDIA HAS A FEMALE FACE Inequality and its impact are experienced by women and men differently. Research has shown that women are less likely to have paid work when compared to men; the paid work that they do bring them less earnings as compared to men due to the existing wage gap and therefore households that rely primarily on female earners tend to be poorer. As per the latest available data (for the year 2011-12), the Gender Pay Gap was 34%, that is women are still receiving 34% less wages than their male counterparts for carrying out the same work. Moreover, women are not a homogenous group and the various intersections of caste, class, religion, age and sexual orientation have further implications on women’s inequality as a process. 1 1 billion = 100 crore 2 Estimated from the data available in the Global Wealth Report 2018, Credit Suisse, available on https://www.credit-suisse.com/ corporate/en/articles/news-and-expertise/global-wealth-report-2018-us- and-china-in-the-lead-201810.html 3http://www.forbesindia.com/lists/india-rich-list-2018/1731/all 4 Estimated from the data available on: https://www. thehindubusinessline.com/economy/number-of-billionaires-to-soar-by- over-50-by-2022-report/article9968726.ece 2
OXFAM INEQUALITY REPORT 2019 India continues to perform poorly in terms of gender, as is evident in its poor performance on the Global Gender Gap Index. In 2018, it was 108th on the World Economic Forum’s Global Gender Gap Index, 10 notches less than in 2006. Indeed, it scored third lowest on health. Its overall performance is far below the global average and behind its neighbours - China and Bangladesh. 39% in Gujarat to less than 1% in Nagaland, Sikkim, Meghalaya, Tripura, and Lakshadweep. While almost all teachers in schools in Delhi, Gujarat, and Puducherry have the requisite academic qualifications, 70% of teachers in Meghalaya continue to lack the necessary qualifications. Where a child is born continues to determine a child’s destiny. IT ROBS INDIA OF ITS HUMAN POTENTIAL Under-funding of Public Services The roots of this marginalization lie deep. While a fair society should offer equal opportunities to all its children, it is often economic status or social identity that dictates its destiny. Forty-two percent of India’s tribal children are underweight, 1.5 times higher than non-tribal children.1 Children from poor families in India are three times more likely to die before their first birthday than children from rich families.2 A Dalit woman can expect to live almost 14.6 years less than one from a high-caste. While the literacy rate in Kerala, Mizoram and the UT of Lakshadweep is over 90%, it is just little above 60% in Bihar. The percentage of children and young people who were never enrolled in school (age group 5-29) in rural areas is double than that of urban areas (NSSO). In India, girls belonging to rich families (top 20%) get on an average nine years of education, while girls from poor families (bottom 20%) get none at all.3 This is not to deny that significant gains have been made since independence. The average longevity has increased dramatically and school enrolment rates have increased. However, India continues to underperform against its own constitutional commitments of creating a just and fair society where every citizen is equally valued. At the heart of this continued poor quality of provision is chronic under investment in public services. Despite India graduating to a lower-middle-income country and accounting for 1/5th of the global burden of disease burden, its public spending on health continues to hover around 1.3% of its GDP4 compared to the commitment made under the National Health Policy, 2017 to increase this to 2.5% of GDP by 2025. Similarly, India’s spending on education has hovered at under 4%, despite successive governments’ electoral commitment to spending 6% of its GDP on education. This is not just a function of meeting an arbitrary figure. India continues to fail to spend what is necessary to realize the minimal norms laid down under the RTE Act. Thus, Bihar spends only 30% of what is required to implement the Act in totality i.e. getting all children into school, hiring the minimum numbers of teachers required, putting infrastructure in place, and placing a textbook in the hands of each learner.5 Research points to a clear correlation between actual per pupil expenditure and learning outcomes.6 A functional school is an essential, if not adequate, condition for any sustainable improvement in India’s education system. I. Poor Public Services for the Poor While spending on education has to be equitable, the government itself often discriminates financially. For example, the per child unit cost in government-run Kendriya Vidyalaya schools for central government employees in transferable jobs is INR 27,000 per child compared to INR 3,000 per student in other Government schools across India.7 The government needs to practice more equitable distribution and investment in children in the country and raise the per child expenditure in non-Kendriya Vidyalaya schools. Addressing these inequalities in achieving human potential requires a robust system of public provisioning of essential services. Yet, there are major gaps in public services in India. A large part of India has accepted the inevitability that public services, especially those targeted at the poor, are of poor quality. The reasons are manifold. There is an acute shortage of health specialists in rural areas. In 2012, according to the World Bank, India had 0.7 doctors per thousand people. In contrast, the United Kingdom had 2.8 doctors per 1000 persons and China had 1.8 doctors per 1000 persons. In tangible terms, it means that India spends INR 1,112 per person on public health per capita every year. This is less than the cost of a single consultation at the country’s top private hospitals or roughly the cost of a pizza at many hotels. That comes to INR 93 per month or Barely 12.7% of India’s schools comply with the minimum norms laid down under the Right of Children to Free and Compulsory Education Act (RTE). There are huge differences between states; it ranges from 4 Rising marginally to 1.4$ GDP in 2017-18 5https://nipfp.org.in/media/medialibrary/2017/12/WP_2017_201. pdf 6 https://www.ideasforindia.in/topics/human-development/india-s- education-quandary-learning-from-learning-outcomes.html 7 https://timesofindia.indiatimes.com/home/education/ Government-spends-Rs-85000-on-each-Navodaya-student-annually/ articleshow/47754083.cms 1 http://rchiips.org/nfhs/factsheet_nfhs-4.shtml 2 http://rchiips.org/nfhs/NFHS-4Report.shtml 3 http://rchiips.org/nfhs/NFHS-4Report.shtml 3
OXFAM INEQUALITY REPORT 2019 INR 3 per day. Indians, therefore, have no other choice but to spend out of pocket on health. As a result, 63 million people are pushed into poverty every year. more willing to socialize with them.4 Unfortunately, private schools frequently fail to sustain inclusive environments in schools, instead creating hurdles to avoid enrolling children with disabilities and from marginalized communities.5 A fifth of the ill in both rural and urban areas deny themselves treatment; 68% of patients in urban India and 57% in rural areas attributed “financial constraints” as the main reason to take treatment without any medical advice. Insurance does not offer an alternative, not least given that most insurance schemes (including the new Ayushman Bharat) fail to cover outpatient costs that account for 68% of expenses. It places girls at particular disadvantage; the gender gap in private school enrolment in India is rising, even as it is closing in government schools.6 World Bank’s Living Standards Measurement Study in Uttar Pradesh clearly shows that gender gap in enrolment even in private schools is increasing over the years. The gender gap in enrolment in private schools for the age group 6-19 years was 1 in 1997-98, which increased to 6 in 2007-08 and further rose to 10 in 2010-11.7 Ironically while India attracts a large number of foreign patients for medical tourism on the plank of ‘world class services at low cost’, only 11% of its Sub Health Centres (SHC) and 16% of Primary Health Centres (PHC) meet the Indian Public Health Standards (IPHS). India manages to simultaneously rank 5th on the Medical Tourism Index and 145th among 195 countries in terms of quality and accessibility of healthcare. Despite declining enrolment in government schools, they remain the mainstay of education provision in India accounting for 73.1% elementary schools8 and 58.6% enrolment. No country has ever universalized education without building a robust and equitable education system; subsidised or free education imparted through public schools is also a great inequality leveller. The government should invest more in public education system to counter the rising inequality in essential public services such as education. The Growth of Private Provision The gap in provision is sought to be filled by a growing private sector. Growth of private provisioning contributes to social segregation with children of the rich and poor in India growing up in parallel universes. Children from financially better off families attend private schools with better facilities and smaller class sizes which extend economic and social advantages of the already more privileged children.1 Private providers in health and education are also under-regulated. A recent government report9 has detailed the exorbitant profit margins of one of those hospitals by prescribing non-scheduled drugs which are outside the regulator’s purview by as much as 12 times the price of scheduled drugs. Between 2010-11 and 2015-16 student enrolment in government schools across 20 states fell by 13 million, while private schools acquired 17.5 million new students.2 Many private schools are unregulated with lack of basic standards of education, safety, and infrastructure. However, the government’s neglect of public schools is leading many parents, including those from poor families, to move their children from public to private schools. This creates an educational system stratified by social class with education quality determined by how much a family can pay. In contrast, when schools provide spaces for rich and poor students to mix, as has been envisaged under Section 12(1)(c) of the RTE Act,3 research suggests that this makes rich students more prosocial, generous, and egalitarian, less likely to discriminate against poor students, and II. The Persistence of Gender Inequality in India There is a clear gender gap between men and women in terms of health, education, economic, and political inequality. While India ranks 108th (of 144) on the World Economic Forum’s Gender Gap Index,10 it is 125th (of 188) on UNDP’s Gender Inequality Index. With one of the lowest female labour force participation in the world 4 Rao, G (2018). Familiarity does not breed contempt: Generosity, Discrimination and Diversity in Delhi schools. bit.ly/2QDKg8n 5 https://timesofindia.indiatimes.com/city/delhi/with-just-3-months- left-in-session-doe-yet-to-fill-over-1200-seats-for-children-with- special-needs/articleshow/67222271.cms 6 Sahoo, S. (2015) Intra-household gender disparity in school choice: evidence from private schooling in India. www.isid. ac.in/~soham9r/ doc/pvt_paper.pdf 7 Sahoo, S. (2015) Intra-household gender disparity in school choice: evidence from private schooling in India. www.isid. ac.in/~soham9r/ doc/pvt_paper.pdf 8 http://udise.schooleduinfo.in/dashboard/elementary# 9https://economictimes.indiatimes.com/industry/healthcare/ biotech/pharmaceuticals/hospitals-prescribe-drugs-excluded-from- price-control-to-boost-profit-nppa/articleshow/63003894.cms 10 https://www.business-standard.com/article/current-affairs/ india-ranks-108th-in-wef-gender-gap-index-scores-third-lowest-on- health-118121900039_1.html 1 https://www.campaignforeducation.org/wp/wp-content/ uploads/2018/04/PPPL_FINAL-EDITION_15-SEPT-2016_A4_WEB.pdf 2 http://archive.indiaspend.com/cover-story/in-5-years-private- schools-gain-17-mn-students-govt-schools-lose-13-mn-26146 3 The section 12-1c fixes the responsibility of private unaided schools to provide free and compulsory education to children from weaker and disadvantaged sections by admitting at least one-fourth of the total strength of class 1 or pre-school education. 4
OXFAM INEQUALITY REPORT 2019 and declining1, India’s growth story has not benefited women and other genders.2 rates of malnutrition as measured by two indicators i.e. being underweight and anaemic.9 Children of women experiencing domestic violence also experienced high levels of malnourishment.10 It goes without saying that malnourished children from violent homes tend to lose out the opportunity to build a better future for themselves. Female labour force participation is often seen as a driver for growth and is indicative of a country’s potential for growth. The female labour force participation is impacted by a wide variety of economic and social factors including economic growth, increasing educational attainment, falling fertility rates, and social norms.3 In India, female labour force participation rates declined from 34.1% in 1999-00 to 27.67% in 2011-12. Between 2012 and 2017 it hovered around 26.81% and 27.21%.4 Though India has many laws that deal with violence against women, their implementation remains a challenge. These challenges include lack of dedicated budgets and the absence of full time government officials and a cadre of duty bearers who know the laws and standard operating procedures. Implementation of laws become more difficult in a deeply patriarchal society. There are differences in rural and urban female labour force participation. The participation rate of rural women decreased from 26.5% in 2009-10 to 25.3% in 2011-12 while the rate for urban women increased from 14.6% to 15.5% over the same period.5 For female wage workers, as against self-employed or casual workers, the participation rate is in single digits.6 At 27% India has one of the lowest female labour force participation rate in the world (juxtaposed to Sweden’s 88 percent). Even when funds are budgeted, their utilisation towards services that would help women overcome violence is very low. One such fund is the Nirbhaya Fund dedicated to Jyoti Pandey, whose brutal gang-rape and subsequent death shook the nation in 2012 and led to the allocation of INR 3100 crores (INR 31 billion) for projects that dealt with different forms of violence. A mere 30% of the funds have been utilised thus far. When governments reduce their expenditures on essential public services such as education and healthcare, women and girls are the first ones to lose out on these services.7 This increases the burden of women’s unpaid care work, which is not accounted for by the family or the economy. Added to this is the increasing rate of violence against women and girls in both public and private spaces. When women face violence continuously and in many ways, it sets them back in economic terms. In the workplace, a law to deal with sexual harassment was passed only in 2013 after a struggle by women’s rights organisations and group of lawyers for 17 years. Yet it is the recent #MeToo movement in India that has opened the doors for the organised workforce to ensure that mechanisms are in place and due process is followed. It is important to understand that a large majority of women are in the informal sector that do not have any formal mechanisms for dealing with sexual harassment. Consequently, where there is an option, women drop out of the labour force; else they continue under exploitative conditions. Violence against Women: A driver of Inequality Violence against women is a breach of fundamental human rights. Studies indicate, for example, that in India women can lose an average of at least five paid work days for each incident of intimate partner violence.8 In health terms too, violence that women face affects them adversely. A study in 2008 explored the adverse impacts of domestic violence on women and children in India. It revealed that women victims of domestic violence experience significantly higher The burden of Unpaid Care Work Women in India spend 312 minutes per day in urban areas and 291 minutes per day in rural areas on unpaid care work. Men correspondingly spend only 29 minutes in urban and 32 minutes in rural areas on unpaid care work. This disproportionate burden of unpaid care work by women means that they lose out on opportunities to participate in paid labour or are forced to undertake paid labour leading to their time poverty and loss in well-being. Unpaid work done by women in India looking after their homes and children is worth 3.1% of the country’s GDP.11 1 Female Labour Force Participation Rate (15-24) was 20.2% in 2012, compared to 35.8% in 1994 2 Data on other genders is scantily available and is an area that needs to be focused. 3 https://www.ilo.org/wcmsp5/groups/public/---asia/---ro-bangkok/--- sro-new_delhi/documents/genericdocument/wcms_342357.pdf 4 https://www.theglobaleconomy.com/India/Female_labor_force_ participation/ 5https://www.ilo.org/wcmsp5/groups/public/---asia/---ro-bangkok/--- sro-new_delhi/documents/genericdocument/wcms_342357.pdf 6 https://www.livemint.com/Opinion/v80I9EwDz6oyklST8ebqMM/ Reversing-womens-decline-in-the-Indian-labour-force.html 7https://d1tn3vj7xz9fdh.cloudfront.net/s3fs-public/file_attachments/bp- women-and-the-one-percent-110416-en_0.pdf 8http://www.endvawnow.org/en/articles/301-consequences-and-costs-. html Unpaid care is a huge hidden subsidy to the economy, 9 https://www.icrw.org/wp-content/uploads/2016/10/Estimating-the- Costs-and-Impacts-of-Intimate-Partner-Violence-in-Developing- Countries-A-Methodological-Resource-Guide.pdf 10 Ibid. 11 https://www.ilo.org/wcmsp5/groups/public/---dgreports/--- dcomm/---publ/documents/publication/wcms_633135.pdf 5
OXFAM INEQUALITY REPORT 2019 which is ignored by standard economic analysis. If governments incorporated an analysis of unpaid care into their economic policies and took greater responsibility for meeting the care needs of their populations, it would go a long way towards tackling economic and gender inequality. In India, direct public investments in the care economy of 2% of GDP would potentially create 11 million new jobs.1 their body. Thus, if a woman fails to do work at home, men feel entitled to beat, deny money, criticise harshly, refuse sex or contrarily rape. Poor value of unpaid care work leads to violence against women Oxfam India researched unpaid care work, including exploring the relation between unpaid care work and gender-based violence. Results from a survey undertaken in the states of Bihar, Jharkhand, Chhattisgarh, and Uttar Pradesh in 1000 households indicate interesting dimensions of this relationship: 53% of those surveyed said that it was acceptable to harshly criticise a woman if she failed to care well for the children and 33% felt it was acceptable even to beat a woman for the same reason. Similarly, 60% felt it was acceptable to harshly criticise a woman if she left a dependent or ill adult unattended and 36% felt it was acceptable to beat a woman for the same reason. Forty- one percent of those surveyed felt it was acceptable to beat a woman if she did not prepare a meal for the men in the family while 68% felt it was acceptable to criticise her harshly for not preparing a meal for the men in the family. Forty-two percent felt a woman should be beaten if she failed to fetch water or fuelwood for her family and 65% felt she deserved to be criticised harshly for failing to do so. A whopping 54% of those surveyed felt it was okay to beat a woman if she left the house without asking and similarly 86% felt she should be criticised harshly for doing so. This puts severe restrictions on women’s ability to go out and undertake paid work. Thus, women’s ability to undertake paid work is not merely determined by economic considerations of high unpaid care burden—the relation between the The segregation of work between men and women, and between the household and the outside world is defined by dominant social norms. And almost universally, women are expected to be primarily responsible for taking care of children, the elderly, the ill, and all household related work including unpaid and unrecognised labour work in the family farm. Men are universally associated with being the main breadwinner of the family; going out of the household to earn an income and therefore be engaged in productive labour. Since income generating work that men are engaged in is accounted for within systems of nationalaccounting, such types of work are well regarded and respected. It gives men a sense of power and authority both in themselves and in their relation with others within the household. While women contribute significantly through their unpaid care work in maintaining this economic status quo, the fact that work done within the household is not considered within systems of national accounting means that theirbackbreaking work is neither recognised norrespected or considered of any value. This gives rise to a system of unequal power relationship within the household where men, emboldened by prevailing social norms, feel that they own the women in their household—their labour and 1 Ibid. Source: Oxfam India Survey 2018
OXFAM INEQUALITY REPORT 2019 two is overwhelmingly determined by social norms as well. It is understood that a woman’s primary role is to take care of the house and her family and any income generating work is secondary to this role. to jobs. In contrast, personal income tax in India is considered as progressive; but, only a tiny fraction of workforce comes under this. The biggest share of direct tax revenue is corporate taxation. However, if we compare it globally, India’s rate is moderate (34.61% compared to a global average of 23.62%). The effective corporate rate, however, taking exemptions into consideration is only 26.87%.3Despite this already low tax rate, corporates are lobbying for further reductions. The government appears inclined towards that direction, albeit accompanied by phasing out of exemptions. If tax exemption and cut in the tax rates are not maneuvered properly, it would lead to accumulation of more private wealth. This may worsen inequality in India. These exemptions are particularly unfortunate given that India’s overall tax revenue is low, reflected in low tax GDP ratio, which means that India has limited resources for providing important public services and expanding the social protection net. Apart from corporate tax, there is a strong case to introduce progressive taxation measureslike the wealth tax and inheritance tax that have the potential to not only generate revenues for the government but also to arrest growing income inequality in the country. III. Fiscal Justice to address Inequality: If people have the space, voice, and agency to exercise their rights and use this to influence and monitor fiscal systems, then they will have the power to mobilize greater revenue and increase spending for quality public services.This is what is referred to as fiscal justice. Global experience demonstrates that fiscal policies, i.e., government policies on taxation and public spending can be among the best tools to fight against extreme economic inequality. A truly ‘progressive fiscal system’ (progressive taxation and pro-poor public spending) redistributes resources and power towards those who are the most excluded and marginalized; and, in turn, it can restrain inequality. At the same time, the revenue thus generated can fund the much needed public services that in turn play a critical role in correcting historical injustices and bringing about increased social equality. This investment, furthermore, fuels a virtuous cycle where stronger investment in human capital leads to greater economic and social progress. Fiscal Justice for Women in India Fiscal justice for women advocates for a fiscal system, which is fair, progressively mobilises greater revenue, and improves spending for quality public services for women and girls and also urges for fiscal policy to be more ‘gender responsive’. While women constitute 49% of the population, their representation as law makers in the Lok Sabha (Lower House of Parliament) is a mere 12%. Overall women’s representation in decision-making positions in all levels of governance is abysmally low. It is evident therefore that there is not enough women’s representation in policy-making positions to ensure historical injustices are reversed and gender equality is assured. Greater representation of women in the parliament will improve the chances of more fiscally just policies for women. Unfortunately, India’s taxation system is regressive due to heavy reliance on indirect taxes. A regressive tax regime is one where an equal amount of tax is borne by the rich and poor; indirect taxes like Value Added Tax (VAT) that are charged equally to anyone making a purchase to obtain a certain amount goods and services are said to be regressive. In 2016-17, 68% of total tax revenues (centre & states combined) was collected from Indirect Taxes, which clearly shows India’s dependence on indirect taxes.1 The newly reformed Goods and Services Tax (GST), which subsumes most indirect taxes is regressive and risks further fuelling inequality. Until recently, sanitary pads were being taxed at 12% GST. This was considered unjust. Why should women be penalised for a basic biological function and why should sanitary pads be taxed as luxury items, instead of essential items, such as condoms which are tax free. This tax has now been abolished and sanitary pads have been made 100% tax free. This is a welcome move. In India 23 million girls drop out of school annually because of lack of toilets in school and proper menstrual hygiene management facilities.2 So making sanitary pads tax-free will help in improving girls’ enrolment in school and their access The Sustainable Development Goal 10 rightly prescribes adopting appropriate fiscal policies, among other measures, to progressively achieve greater equalities. This includes government policy interventions at both expenditure (mainly, Gender Responsive Budgeting (GRB)) and revenue mobilisation sides (tax exemptions, etc.). 3 Corporate Tax Exemptions, Working Paper, OIN https://www. oxfamindia.org/sites/default/files/2018-10/Corporate%20Tax%20 Exemptions.pdf 1 Indian Public Finance Statistics 2016-17. 2 https://swachhindia.ndtv.com/23-million-women-drop-out-of- school-every-year-when-they-start-menstruating-in-india-17838/ 7
OXFAM INEQUALITY REPORT 2019 Although India had formally adopted GRB in 2005-06, initiatives for mainstreaming gender issues in policy formulation is typically traced back to 1974, when India had initiated the ‘women component plan’ for quantifying women specific expenditures across the department/ministries. Since the adoption of GRB in 2005-06, both the Central Government and more than half of the State Governments now show information on women specific allocations and also on women beneficiaries in their respective budgets. gender inequality in India on the taxation side. The only important affirmative policy for empowering women is the rebate on stamp duty when a property is registered in the name of a woman whether it is single or co- ownership. Policies like higher tax exemption limit for women, which had some positive impact on earnings of women, has been abolished since 2012-13. India’s heavy reliance on indirect taxes (mainly VAT) creates unfair burden on women. The aggregate incidence of tax is higher for female-headed households than it is for male-headed households; albeit some differences across various expenditure categories exist. In the new Goods and Services Tax (GST) regime, the rates for different commodities must be scrutinised carefully from the perspective of gender and poverty to avoid placing an unfair burden of taxes on women and poor households. In the 2005-06 budget, nine departments/ministries showed gender specific schemes and allocations, and the total magnitude of gender budget was INR 24,241 crore (RE) (INR 242.41 billion), which was 4.8% of the total union budget; it reached a peak level of 5.8% in 2011-12. In between 2011-12 and 2018-19, the total allocation for women specific schemes declined and in 2018-19 (BE), the total magnitude of gender budget was INR 1,21,961 crore (INR 1219.61 billion), which is 5.2% of the total union budget. In the financial year 2018-19, demands from 33 departments/ministries and 5 union territories’ reflect women specific programmes and schemes, and corresponding allocations/ expenditures. It is a very positive sign that following the centre, out of total 29 states around 20 state governments have adopted gender budgeting. Till 2015, 57 central ministries/departments had set up gender budgeting cells (GBCs) for more proactive initiatives towards gender mainstreaming of their policies, programmes, and budgets. However, inadequate human resources is a major challenge to reaching out to more departments and states for their capacity building, and to guide them to implement gender budgeting. Fiscal Justice for other marginalized groups India’s Constitution provides a series of protective and development measures and ensuring affirmative action to bring Scheduled Castes (SCs) and Scheduled Tribes (STs) at par with the rest of society. In 1979, the government introduced Scheduled Caste Sub Plan (SCSP), a strategy that earmarks funds for development of SCs, across sectors, at least in proportion to their share in the overall population of the country (16.6% as per Census 2011). While there has been a consistent incremental increase in allocation to the same, what has been missing is a comprehensive strategy to ensure targeted, policy-driven benefits. Many of the inclusions provide only incidental benefits to SCs from general schemes and programmes. This is compounded by weak overall monitoring. Similar challenges are encountered during the implementation of the Tribal Sub Plan (TSP) introduced in 1974 which fails to provide for need- based planning. Only 0.49% of the total Union Budget There are very limited policy interventions to address 8
OXFAM INEQUALITY REPORT 2019 2016-17 had been earmarked for the development of minorities, despite this group constituting 21% of the population.1 Along with the GRB, a focus on equity in financing more broadly and progressive tax policies, an institutionalised set up, where women and marginalized groups have the space, voice and agency to exercise their rights in order to monitor and influence fiscal systems would be helpful for mainstreaming gender and inclusion issues. This platform could work as a catalyst to achieve gender equality through fiscal justice. Cracking Down on Corruption Tackling corruption is central to achieving universal public services and social protection. Corruption impacts inequality in different ways. As the most basic level, the poorest people are more likely to have to pay bribes. In India, Transparency International data shows that India’s ranking slid to 81 among a group of 180 countries.2 The Corruption Perception Index 2017 also singled out India as one of the ‘worst offenders’ in the Asia-Pacific region. The index measures perception of corruption in the public sector. India’s score remained intact at 40 points in both 2016 and 2017; it is below the global average of 43. Transparency International found that crackdowns on non-governmental organisations (NGOs) and media were associated with higher levels of corruption in the world. The 2018 CMS-India Corruption Study found that 75% households have the perception that the level of corruption in public services has either increased or remained same during the last 12 months. Further, perception aboutUnion government’s commitment to reduce corruption in public services has seen a decline from 41% in 2017 to 31% in 2018.3 However, a different India is possible. Inequality is not inevitable; it is a policy choice that countries make. It is not inevitable that the rich get richer, while the poor die since they cannot afford essential medicines. Provision of public services and social protection contribute towards the creation of fairer societies, promote wealth, pull societies together, and close the gap between rich and poor and between women and men. However, public services are frequently not structured in a way to make best use of their potential. 1 http://www.cbgaindia.org/wp-content/uploads/2018/02/Of-Hits- and-Misses-An-Analysis-of-Union-Budget-2018-19-2.pdf 2 https://www.transparency.org/country/IND# 3 http://cmsindia.org/cms_ics18/CMS_ICS_2018_Report.pdf 9
OXFAM INEQUALITY REPORT 2019 Oxfam’s Recommendations to the Government of India 9. Establish realistic implementation plans for women specific funds such as the Nirbhaya Fund so that they are utilized to the fullest for the benefit of women and their safety. Ensure provisioning of Education and Health services by the State: 1. Strengthen education and public health by increasing government spending to meet global benchmarks of 6% and 3.5% of GDP, respectively. Progressively make school education free and reduce out-of-pocket expenditure on health which affects the poor, women, and the marginalized more adversely. 10. Revise definition of ‘work’ by NSSO to include recognition of domestic work as an economic activity since it involves time, energy and labour. 11. Provide strategic and effective (quality) infrastructure facilities such as crèches at the community level for homebased workers and at construction sites both in rural and urban areas. 2. Enhance the education budget to ensure all schools comply with the minimum RTE norms and gradually enhance investments to bring all schools to a universal standard of quality, in line with the Kendriya Vidyalaya norms. 12. Develop a policy framework that recognizes care as a universal right guaranteed by the State through an effective social protection system and invest in the care economy. 3. Expand and strengthen the public healthcare system to ensure quality and availability of free healthcare, medicines and diagnostics at primary, secondary and tertiary levels and increase availability of staff and infrastructure, especially in in rural and remote areas, for a more equitable access to health services by the poor, the marginalized, and women. Ensure Fiscal Justice to the Poor and Marginalised: 13. Put in place progressive fiscal policies to address the extreme inequality situation in India. In taxation, the focus should be more on generating revenue from direct taxes. Ensure proper mobilisation of property & wealth taxes. Rationalize corporate tax exemptions/ incentives. 4. Stop commercialization of health and education and put in place robust measures to regulate private health and education providers. 14. Scrutinise the new Goods and Services Tax (GST) regime from the perspective of the poor. The rates for different commodities should be such that they do not place an unfair burden of taxes on the poor households. Take concrete measures to address Gender Inequality: 5. Increase focus on Gender Budgeting at the national level by addressing the limitation of its present form; this practice must be extended to all states. 15. Address the needs of the underfunded social sector in India. More public resources should be mobilised for providing basic essential services like health and education, social protection, etc. to reach out to the poor and excluded. The affirmative policy interventions like Gender Budgeting, Scheduled Caste Sub Plan, Tribal Sub Plan, etc. must be implemented properly. 6. Strengthen Gender Budgeting cells with more human resources to reach out to more department and states for their capacity building, and to guide them to implement gender budgeting. 7. Adopt a bottom up approach of planning to gender budgeting. As per the recommendations of the Fourteenth Finance Commission, huge amount of resources is transferred to local authorities. MWCD (Ministry of Women and Child Development) and the State governments should give proper instruction and guidance to the local authorities for preparing Gender Responsive Budgeting. 8. Bring back affirmative policies like higher tax exemption limit for women and continue other policies like stamp duty exemption/rebate for women. 10
OXFAM INEQUALITY REPORT 2019 FOR MEDIA QUERIES, PLEASE CONTACT HIMANSHI MATTA himanshi@oxfamindia.org