1 / 48
480 likes | 482 Views
This report studies the representation of people from different caste groups in the Indian media. It documents who has a seat at the table and whose voice has a chance of being heard.

E N D
| 1 Representation of marginalised caste groups in Indian Newsrooms Released on: 2nd August 2019 Cover Art: Shivanee Harshey
2 | WHO TELLS OUR STORIES MATTERS Acknowledgments This report is a collaborative effort of Oxfam India and Newslaundry. The report is researched and written by the Newslaundry team of Sarthak Bhatia, Shyam Sundar Sridhar, Tanika Chandna, Mehraj D Lone and supervised by Oxfam India’s media lead Himanshi Matta. We thank Anandita Bishnoi for designing the report, Shivanee Harshey for designing the cover and The Media Rumble team for releasing it. Oxfam India is grateful to Prof Kaustav Banerjee, Prof Shaifullah Anis and Sudipto Mondal for their expert advice. We acknowledge the efforts of our colleagues Himanshi Matta and Tejas Patel for leading the project, and Savvy Soumya Misra and Tomojit Basu for reviewing and providing feedback. This report would not have been possible without the hard-work of Newslaundry’s research associates; Alisha Sachdeva, Deepita Shukla, Hanishek Honey, Shefali Mehta, Subia Ahmad, Suyashi Smridhi, Veydaant Khanna We also thank the young enthusiastic team of interns for helping us with the project; Amandeep, Avantika Mohan, Ayushi Mishra, Fiza Mishra, Harsh Shukla, Pooja Verma, Pratik Waghmera, Pratiksha Thayil, Sanaa Sharma, Subhiksha Manoj, Sucharita Ganguly, Supriti David, Tiyashi Datta, Udita Shome, Vaidehi Sahasrabhojanee. The report is aimed at opening, and informing, a public debate on discrimination and social exclusion in the media.
TABLE OF CONTENTS INTRODUCTION 1 METHODOLOGY Selected Sources Data Collection Caste Identification 3 KEY HIGHLIGHTS 6 ENGLISH TV NEWS 7 HINDI TV NEWS 13 ENGLISH NEWSPAPERS 19 HINDI NEWSPAPERS 24 DIGITAL MEDIA 29 MAGAZINES 33 REMARKS 37 APPENDIX 1: SOURCES 38 APPENDIX 2: QUALITATIVE HEADS 39 APPENDIX 3: FIELDS OF PANELLISTS 40 APPENDIX 4: QUESTIONNAIRE 41
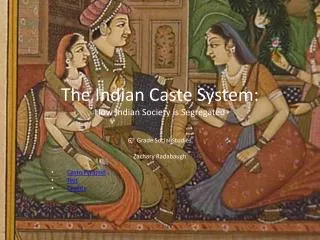
1 | WHO TELLS OUR STORIES MATTERS Introduction After searching the country for more than 10 years, I have been able to find eight Dalit journalists in the English media. Only two of them have risked ‘coming out’.” “ Sudipto Mondal, Al Jazeera, June 2, 2017 This report studies the representation of people from different caste groups in the Indian media. It documents who has a seat at the table and whose voice has a chance of being heard. The aim is to open a critical dialogue about the limited representation of marginalised caste communities in the media’s work and workplaces, and its impact on viewpoints that inform and shape the news discourse. Tribes. The Indian constitution uniquely identifies the Scheduled Castes, Scheduled Tribes, and Other Backward Classes – mostly comprising the Sudra and some sections of the country’s religious minorities – for affirmative action. The national census of 2011 shows that Scheduled Castes are 16.6% of India’s population and Scheduled Tribes 8.6%, while the 1950 census records the OBC population at around 56%. The rest are listed under ‘General Category’ and are commonly described as the upper castes. In the past few decades, the media has transitioned from being an authority that informed the public to one that is increasingly used to mould, even manufacture public opinion. Those who get to decide the news discourse thus possess great power. If they are drawn largely from dominant social groups, they are likely to push the dominant perspectives. This defeats the essential purpose of the media which is to reflect the diverse society we live in. Though the constitution guarantees protection against negative discrimination, caste continues to influence hiring patterns and public opinion in the country. In the absence of data or a caste-based census, however, it is difficult to make authoritative claims about caste representation in the Indian media. This study aims to rectify that to some extent. In India, while a handful of news organisations recognise the need to be diverse and inclusive, the majority remain blind to their privileged structures. The skewed caste equation in the newsroom reflects in the way news is collected or presented. Absent a voice from marginalised caste groups, the news becomes merely the perspective of a privileged reporter, writer, or TV panellist. We examined English and Hindi newspapers, flagship debate shows on television, digital news outlets, and magazines to collect caste details of reporters, writers, and debate panellists in order to provide a comprehensive report on the representation of marginalised caste groups in the media. We also aimed to draw a qualitative picture of which groups get to speak on various subjects and to what extent. Caste is an ancient system of hierarchical segregation of people determined by birth. It is based on notions of purity and pollution, and rooted in Hindu doctrine. The caste system divides Hindus into four Varnas of Brahmin, Kshatriya, Vaishya, and Sudra. Those who fall outside these endogamous groups, each with a preordained social function, are known as Dalits or Scheduled Castes, and Adivasis or Scheduled Getting someone to disclose their caste can be discomforting for them, not least because of its association with status, purity, and pollution. Though a person’s caste can be deduced from their surname, it is an unreliable method and can even be misleading. So, we used large datasets such as examination
Introduction | 2 results of the Union Public Service Commission and the Delhi University to map surnames to castes. Where possible we used consensual surveys to collect caste details of journalists, writers, and debate panellists. We take complete responsibility for any gap or oversight that might still exist in the report. Our study indicates that the Indian media is predominated by the upper castes, that is, Brahmins, Kshatriya, and Vaishyas. The Scheduled Tribes are almost entirely absent, whereas the Scheduled Castes are represented mostly by social activists and politicians rather than journalists. The OBCs are similarly underrepresented even though they are estimated to constitute over half of India’s population. We employed a range of methods and channels to make our research robust, and to reduce margins of error. We sought to assemble a diverse team, reserving positions for members of marginalised communities. But constraints of time and resources compelled us to work with a team that was largely upper caste. We recognised that this representation gap could make it hard for us to identify our own blind spots. So, we reached out to external experts working on caste in the media and the academia to seek feedback on the methodology and other aspects of the study. This report provides substantial evidence that vast sections of India’s marginalised caste groups lack access to the media platforms and discourses that shape public opinion, leading to their invisibilisation. We hope it will serve as a preliminary step towards addressing the problem.
3 | WHO TELLS OUR STORIES MATTERS Methodology Data Collection This study, conducted from October 2018 to March 2019, used the method of ‘byline count’ to analyse the representation of people belonging to different caste groups in the print media. We sifted through bylined articles from the newspapers and magazines, and entered the demographic details of each writer into a database. In case of news channels, we noted down the names of anchors and debate panellists, and determined their castes through publicly available sources, surveys, or triangulation. Primary We collected data from the front page of each newspaper as well as its opinion, economy and sports pages published between October 2018 and March 2019, and manually entered it into our database. In case of the TV channels, we watched the flagship debates on their websites or official YouTube channels, and manually entered the demographic details of their anchors and panellists. Selected Sources We selected six English and seven Hindi newspapers based on their ranking in the Indian Readership Survey of 2018 and the availability of online archives. Given the sheer volume of their content, the digital outlets presented a unique problem. So, we used MediaCloud, an open-source software tool for media analysis, to collect relevant data, and restricted our analysis to writers who contributed at least five articles during the period under consideration. In case of the English newspapers, we used editions from cities where they had the highest circulation or where they were headquartered. Since most of the Hindi newspapers did not have national editions, we looked at their city editions from various Hindi- speaking states. In case of the magazines, we limited our analysis to the lead story of each issue and the stories highlighted on the cover page. For TV news, we chose seven English and as many Hindi channels, and analysed their flagship debate shows. While the English channels aired such shows in the prime time slot between 8 pm and 11 pm, during the six months of this study, some of the Hindi channels did so in the evening slot, from 5 pm to 7 pm. The data was collected by watching the debates and entered manually. The raw data collected from all these archives included: 1) Name of the media outlet 2) Date of publication or broadcast 3) Page title or prime time slot 4) Name of the TV programme 5) Name of the writer(s) 6) Name of the anchor(s) 7) Name of the panellist We also examined 11 digital media outlets and 12 magazines covering a range of interests, from Politics and Business to Culture and Sports. They included the four most widely read magazines according to the Indian Readership Survey of 2018. Where an article was written by multiple people, each writer was considered to have penned it separately. Articles by news agencies, news desks, editors, or unnamed correspondents were not considered. The sources are listed in Appendix 1.
Methodology | 4 We aimed to find out the number of journalists, writers, and TV panellists from marginalised caste groups in the media, and the volume of their work compared to their upper caste counterparts. So, we calculated the number of their bylined articles or the number of their TV appearances. These twin data points helped us compare caste representation in absolute numbers as well as in relative terms, that is, how much space they were getting on different media platforms. Participants in TV debates were categorised into 14 ‘fields’ on the basis of their professional background – they either represented their political groups or official positions or were subject experts. This categorisation helped us underline the caste identities of people invited on TV as authoritative voices and what kind of viewpoints they legitimised. The full list of fields is given in Appendix 3. Caste Identification We also measured the share of marginalised groups in newsroom leadership positions. A journalist was defined to hold a leadership position if they were designated editor-in-chief, managing editor, executive editor, bureau chief, or input/output editor. Someone holding more than one of these positions in the same organisation was counted only once. Leadership data was not available for News 18 India, Rajya Sabha TV, Navbharat Times,and Dainik Bhaskar. The way caste works in the Indian subcontinent has long been a subject of curiosity for sociologists. As more information is made available about a person – say, the region they come from, their traditional occupation, or dialect – the probability of predicting their caste increases. In the past, several journalists and organisations have examined the media’s caste dynamics. We relied in particular on a 2006 study by the Media Study Group and the Centre for the Study of Developing Societies as well as investigative reports by journalists such as Shivam Vij, BN Unniyal, and Ajaz Ashraf to frame our initial hypothesis. Secondary We set out to understand what kind of issues were being discussed in the media, and by journalists, writers and debaters of which caste groups. To this end, we categorised the entire corpus of bylined articles and flagship debates under 11 broad qualitative heads or ‘topics’. We kept the topics as mutually exclusive as possible, while conceding that there might be overlaps in case of some articles or debates. We considered the context of each such article or debate before filing it under a qualitative head. The full list of topics is given in Appendix 2. We used the following identifying categories for journalists, writers, and debate panellists: • The four constitutional groups of General Category, Scheduled Caste, Scheduled Tribe, and OBC • Can’t Say • Not Available Their caste details were collected in three stages. The articles and debates were further categorised as being about caste if they specifically raised a caste issue. This category was kept separate from the list of the 11 qualitative heads since caste issues can cut across topics. For example, a story about the commemoration of the Battle of Bhima Koregaon was listed under the head of ‘Public Life’ and also categorised as an ‘article on caste’. We sent a questionnaire to hundreds of journalists, writers, and TV panellists seeking details such as their age, place of birth, gender, religion, caste, and socio-economic background. We used various means, including phone and social media, to reach out to them. We made sure to inform them about the nature and purpose of this study. The questionnaire is given in Appendix 4.
5 | WHO TELLS OUR STORIES MATTERS For a small number of prominent writers and panellists, we collected their caste details from credible sources in the media fraternity and cross- checked the information with their own statements and declarations. This method was used exclusively for public figures whose caste identities were almost common knowledge. However, the castes of about 10% of the people in our database could not be deduced from any of the three methods mentioned above. Among these were persons whose last names did not appear in the examination results. They were categorised as ‘Can’t Say’. Christian, Muslim and Parsi journalists, writers, and panellists were categorised under ‘Not Available’, even though caste is prevalent to some extent among Indian Christians and Muslims. This was done because their last names could not be easily matched with castes. All non-Indian journalists, writers, and panellists were identified and excluded from the analysis. Through these two methods, we were able to determine the castes of about 15% of the journalists, writers, and panellists in our database. Since the scope of this study was quite wide and the responses to our survey far from desired, we used triangulation to work out the castes of a good number of people. We obtained the examination results of the Union Public Service Commission and the Delhi University for the past seven years. These are considered authentic sources of information on caste since government-issued certificates are required to validate the caste of each candidate taking these exams. The two datasets contained nearly 1,00,000 names along with their castes. Our assumption was that by mapping surnames to castes in these datasets, we would be able to determine the castes of the majority of journalists, writers, and panellists who shared those surnames in our database. So we did, identifying the castes of three-fourths of the people in our database. We feel a large and comprehensive questionnaire- based survey may be the most precise way to map caste representation in the Indian media. We approached the editorial offices of several media houses to carry out a voluntary demographic survey of their staff to measure caste representation, but could not convince most of them. A few expressed their support but insisted that we do not name their organisations while publishing the results of the survey. Several individual journalists filled in all the details in our questionnaire except their names. Agreeing to the condition of anonymity would have defeated the very purpose of our research, so we declined. We hope that this study will help convince all stakeholders, including media houses, to make such an investigation possible.
Key Highlights | 6 Key Highlights Of the 121 newsroom leadership positions – editor-in-chief, managing editor, executive editor, bureau chief, input/output editor – across the newspapers, TV news channels, news websites, and magazines under study, 106 are occupied by journalists from the upper castes, and none by those belonging to the Scheduled Castes and the Scheduled Tribes. Three out of every four anchors of flagship debates are upper caste. Not one is Dalit, Adivasi, or OBC. For over 70% of their flagship debate shows, news channels draw the majority of the panellists from the upper castes. No more than 5% of all articles in English newspapers are written by Dalits and Adivasis. Hindi newspapers fare slightly better at around 10%. Over half of those writing on issues related to caste in Hindi and English newspapers are upper caste. Around 72% of bylined articles on news websites are written by people from the upper castes. Only 10 of the 972 articles featuring on the cover pages of the 12 magazines under study are about issues related to caste.
7 | WHO TELLS OUR STORIES MATTERS English Television News This study looked at seven English TV news channels – CNN-News 18, India Today, Mirror Now, NDTV 24x7, Rajya Sabha TV, Republic TV, and Times Now. of minority communities were being confined to their religious identities. (Figure 6) Some 70% of the panellists invited to debate political issues belonged to the upper castes or religious minorities. By the number of appearances, the proportion of such panellists rose to 80%, showing that they were invited much more frequently than people from other groups. (Figure 7) Nearly 89% of the leadership positions across these channels were held by upper caste journalists and none by members of the Scheduled Castes, Scheduled Tribes, or OBCs1. (Figure 1) From October 2018 to March 2019, the seven channels together telecast 1,965 shows of their flagship debates in which 1,883 panellists took part. Of the 47 anchors of these shows, 33 were upper caste. (Figure 2) Regardless of the topic being discussed, the Scheduled Tribes were barely represented. Members of marginalised caste groups, in fact, were shut out of debates on caste issues. (Figure 8) Over half of the debates featured upper caste-majority panels, reflecting the dominant caste character of Indian English TV news. Rajya Sabha TV had upper caste-majority panels for over 80% of its shows. (Figure 3) FIGURE 1: Leadership Positions (%) 10.7% Across the channels, 60%-76% of the top decile of panellists by the number of appearances were upper caste. India Today and Times Now each drew only about 10% of their panellists from the Scheduled Castes, Scheduled Tribes and OBCs. (Figure 4) GEN SC 89.3% ST OBC NA CAN’T SAY Around 30% of the panellists who participated in the flagship debates were either religious minorities or their castes could not be identified. Of the rest, 79% were upper caste and 12% OBC. (Figure 5) FIGURE 2: Caste composition of anchors (%) On an average, two out of five panellists according to the number of appearances in debates belonged to a political group, underlining deep professional links between the media and the political establishment in India. Of such panellists, over 65% were either upper caste Hindu or from religious minorities. The majority of the panellists from the fields of Business and Think Tank were upper caste, while members of minority communities most often represented religious institutions or groups. This indicates that members 2.2% 22.2% GEN SC ST OBC NA CAN’T SAY 75.6% 1 Data not available for CNN-News 18 India and Rajya Sabha TV
English Television News | 8 FIGURE 3: Debates where majority of panellists were upper caste (%) 100 80.8 80 71.4 68.6 65.9 63.9 54.2 60 52.7 (Percentage) 40 20 0 CNN India Today Mirror Now NDTV 24x7 Rajya Sabha TV Republic TV Times Now News18 FIGURE 4: Top decile of panellists by appearance (%) 100 10.2 5.7 14.3 13.4 6 11 8.7 8.3 8.9 16.7 6.4 0.2 18.9 15.7 14.4 9.1 8.5 80 8.6 0.2 0.2 6.9 0.1 76.1 7.5 0.1 7.4 0.1 7.1 0.1 5.1 68.6 4.9 3.8 64.2 3.3 61.7 5.7 60.8 4.4 60.2 60 66.4 (Percentage) 40 20 0 CNN India Today Mirror Now NDTV 24x7 Rajya Sabha TV Republic TV Times Now News18 GEN SC ST OBC NA CAN’T SAY
9 | WHO TELLS OUR STORIES MATTERS FIGURE 5: Overall caste composition (%) 60.7 6.7 0.3 6.0 13.9 12.3 CNN-News18 Appearances 55.9 6.0 0.6 7.6 14.9 14.9 CNN-News18 Panellists 66.5 3.7 0.1 6.4 15.2 8.1 India Today Appearances 55.5 5.7 0.2 7.9 20.1 10.6 India Today Panellists 56.5 4.9 0.3 8.4 11.5 18.5 Mirror Now Appearances 6.0 0.4 8.1 19.5 53.8 12.4 Mirror Now Panellists 67.1 4.5 0.3 7.3 10.7 10.0 NDTV 24x7 Appearances 5.4 0.4 9.4 15.7 56.7 12.4 NDTV 24x7 Panellists 70.2 6.5 1.8 6.0 1.5 14.1 Rajya Sabha TV Appearances 4.8 1.7 7.0 13.2 70.0 3.3 Rajya Sabha TVPanellists 52.7 4.9 0.2 7.6 26.0 8.6 Republic TV Appearances 4.9 0.6 7.3 10.4 57.4 19.4 Republic TV Panellists 55.0 3.0 0.2 6.0 28.1 7.7 Times Now Appearances 4.3 0.7 8.4 14.0 52.6 20.0 Times Now Panellists 58.2 4.6 0.3 6.9 19.1 10.8 TOTAL Appearances 5.6 0.7 8.3 16.8 54.9 13.6 TOTAL Panellists 0% 20% 40% 60% 80% 100% GEN SC ST OBC NA CAN’T SAY
English Television News | 10 FIGURE 6: Panellists from different fields (%) Panellist Field GEN ST NA SC Can’t Say OBC Academia 52.2 0.2 9.0 Appearances 4.1 13.2 21.3 Academia 55.5 0.4 11.4 Panellists 5.7 17.0 10.1 Bar And Bench 49.1 0.4 26.0 Appearances 2.5 16.9 5.0 Bar And Bench 52.5 1.4 15.6 Panellists 4.2 18.4 7.9 Bureaucrat 63.4 0.4 4.2 Appearances 7.9 16.4 7.8 Bureaucrat 64.4 0.3 7.4 Panellists 5.3 14.1 8.6 Business 79.1 0.1 2.8 Appearances 1.9 11.1 5.1 Business 68.7 0.1 4.8 Panellists 2.6 19.0 4.8 Defence Expert 64.2 0.1 7.4 Appearances 11.9 6.5 9.9 Defence Expert 66.2 0.2 7.1 Panellists 5.3 11.2 9.9 Financial Expert 49.8 0.0 1.9 Appearances 2.9 43.4 2.0 Financial Expert 59.5 0.0 4.5 Panellists 5.3 27.3 3.4 Independent Expert 50.3 0.3 22.7 Appearances 5.4 14.4 7.0 Independent Expert 51.1 0.3 15.8 Panellists 5.5 19.5 7.7 Media 58.4 0.8 14.6 Appearances 6.0 14.1 6.0 Media 57.1 1.3 13.7 Panellists 5.0 16.5 6.4 NGO and CSO 50.5 0.2 25.4 Appearances 3.7 12.2 8.0 NGO and CSO 49.4 0.5 14.3 Panellists 7.6 19.8 8.3 Party Spokespersons 63.6 0.1 20.9 Appearances 3.1 7.2 5.2 Party Spokespersons 52.4 0.3 15.3 Panellists 6.3 15.5 10.2 Political Analyst 49.4 0.3 25.6 Appearances 7.0 6.3 11.4 Political Analyst 56.0 0.3 14.0 Panellists 5.2 18.0 6.5 Religious 42.7 0.0 47.8 Appearances 3.8 4.3 1.3 Religious 18.3 0.1 50.0 Panellists 9.9 18.8 3.0 Social Activist 52.1 0.8 23.2 Appearances 2.8 16.3 4.7 Social Activist 50.5 1.2 16.9 Panellists 5.5 18.0 7.9 Think Tank 81.5 0.9 2.2 Appearances 4.8 4.7 6.0 Think Tank 65.1 2.1 3.8 Panellists 5.4 13.5 10.1
11 | WHO TELLS OUR STORIES MATTERS FIGURE 7: Topics discussed by panellists (%) 70.6 3.7 0.3 6.1 6.2 13.2 Business and Economy Appearances 67.6 5.3 0.4 8.1 5.7 12.9 Panellists 54.9 4.7 0.5 7.2 21.1 11.6 Crime And Accident Appearances 55.5 4.8 0.7 7.3 17.0 14.6 Panellists 56.4 4.7 0.1 6.0 18.5 12.0 Culture And Entertainment Appearances 58.2 4.2 0.1 5.5 22.2 9.7 Panellists 55.5 5.8 0.2 7.2 22.3 9.0 Defence And National Security Appearances 54.7 4.1 0.3 7.3 21.8 11.7 Panellists 57.3 4.2 0.2 6.7 8.0 23.5 Environment And Energy Appearances 55.2 5.4 0.2 8.0 7.6 23.7 Panellists 56.6 6.5 1.6 6.3 11.8 17.2 International Affairs Appearances 56.7 4.4 0.8 6.6 19.7 11.8 Panellists 58.6 4.5 0.2 6.9 21.0 8.7 Politics Appearances 54.1 6.0 0.6 8.7 16.4 14.2 Panellists 55.4 4.2 0.5 7.0 18.1 14.9 Public Life Appearances 56.9 4.8 0.6 7.5 15.1 15.1 Panellists 87.3 5.0 7.7 Science And Technology Appearances 87.3 5.0 7.7 Panellists 37.8 3.8 0.5 12.7 33.9 11.3 Sports Appearances 43.2 2.1 9.7 31.1 13.3 0.6 Panellists 60.4 4.4 0.2 6.9 17.2 10.9 State And Policy Appearances 54.9 5.8 0.4 8.0 14.4 16.5 Panellists 0% 20% 40% 60% 80% 100% GEN SC ST OBC NA CAN’T SAY
English Television News | 12 FIGURE 8: Panellists debating caste issues (%) 100 13.3 14.3 11.6 10.4 9.1 27.3 10.9 2.2 0.4 10.8 9.8 4.7 0.1 4.0 77.8 11.6 9.5 8.5 80 9.8 78.3 12.3 10.2 80.2 16.7 0.4 6.4 62.0 0.1 0.4 4.4 59.7 60 12.6 2.3 (Percentage) 53.3 53.8 40 20 0 CNN India Today Mirror Now NDTV 24x7 Rajya Sabha TV Republic TV Total News18 GEN SC ST OBC NA CAN’T SAY
13 | WHO TELLS OUR STORIES MATTERS Hindi Television News All leaderships positions across the Hindi news channels chosen for this study – Aaj Tak, News 18 India, India TV, NDTV India, Rajya Sabha TV, Republic Bharat2, Zee News – were occupied by upper caste journalists.3 (Figure 1) While 17.9% of the panellists from the Academics field belonged to minority communities, none of them were invited to discuss matters of Science and Technology or Environment and Energy. (Figure 7) Around 70% of the panellists invited to debate caste issues were upper caste. (Figure 8) Eight out of every 10 anchors of flagship shows across the seven channels were upper caste, and not one belonged to the Scheduled Castes, Scheduled Tribes, or OBCs. (Figure 2) FIGURE 1: Leadership Positions (%) On each channel, over two-thirds of the debate featured upper caste-majority panels. In case of Rajya Sabha TV, nine out of 10 panels were dominated by upper caste individuals. (Figure 3) GEN 100.0% Across the channels, two-thirds of the panellists in the top decile by appearance were upper caste, while a fifth were from religious minorities. (Figure 4) SC ST OBC NA CAN’T SAY Of the 1,248 panellists who participated in 1,184 debates across the seven Hindi news channels, castes of around a fourth could not be determined or they belonged to religious minorities. Of the rest, 80% were upper caste. Nearly 70% of the total panellists who appeared on the state-run Rajya Sabha TV were upper caste, while News 18 India and Republic Bharat each drew over a quarter of their panellists from minority communities. (Figure 5) FIGURE 2: Caste composition of anchors (%) 7.3% 12.2% GEN SC Almost all panellists categorised under Bar and Bench who appeared on News 18 India, India TV, and Republic Bharat belonged to minority communities, while Rajya Sabha TV never invited a lawyer or jurist from a minority group during the six months under consideration. (Figure 6) ST OBC NA CAN’T SAY 80.5% 2 Data only for February and March as the channel was launched in February 2019. 3 Leadership positions data was not available for News 18 India and Rajya Sabha TV.
Hindi Television News | 14 FIGURE 3: Debates where majority of panellists were upper caste (%) 100 89.1 76.0 80 73.9 73.0 69.9 65.9 64.1 60 (Percentage) 40 20 0 Aaj Tak News 18 India India TV NDTV India Rajya Sabha TV Republic Bharat Zee News FIGURE 4: Top decile of panellists by appearance (%) 100 4.6 4.0 3.7 2.1 14.6 3.2 6.5 4.4 0.6 2.7 2.7 27.0 24.0 23.0 21.5 25.9 7.0 2.2 5.5 79.9 80 3.3 4.0 67.0 5.1 1.6 3.3 2.0 2.8 1.9 4.4 69.6 2.5 4.7 63.0 1.6 64.1 5.0 62.2 5.7 60.9 60 (Percentage) 40 20 0 Aaj Tak News 18 India India TV NDTV India Rajya Sabha TV Republic Bharat Zee News GEN SC ST OBC NA CAN’T SAY
15 | WHO TELLS OUR STORIES MATTERS FIGURE 5: Overall caste composition (%) 67.4 4.4 1.6 4.2 16.8 5.7 Aaj Tak Appearances 57.9 6.3 0.5 8.2 19.6 7.4 Aaj Tak Panellists 67.4 2.9 1.1 4.8 17.6 6.1 India TV Appearances 63.6 3.9 1.0 5.1 20.0 6.5 India TV Panellists 65.2 5.6 0.9 9.9 10.9 7.5 NDTV India Appearances 6.0 1.3 10.3 8.4 63.6 10.5 NDTV India Panellists 57.7 5.4 2.1 4.3 26.2 4.4 News18 India Appearances 6.0 1.1 5.4 6.2 55.1 26.2 News18 India Panellists 73.3 6.7 1.1 7.8 4.1 7.1 Rajya Sabha TV Appearances 6.2 1.3 7.8 9.6 69.9 5.2 Rajya Sabha TVPanellists 57.9 6.0 0.1 4.8 27.6 3.5 Republic Bharat Appearances 4.4 0.1 4.3 2.9 59.2 29.1 Republic Bharat Panellists 61.7 4.5 0.4 5.2 22.7 5.6 Zee News Appearances 5.0 0.5 7.3 12.4 57.0 17.6 Zee News Panellists 64.6 4.7 1.1 5.4 18.4 5.8 TOTAL Appearances 5.9 0.6 8.6 10.1 60.6 14.3 TOTAL Panellists 0% 20% 40% 60% 80% 100% GEN SC ST OBC NA CAN’T SAY
Hindi Television News | 16 FIGURE 6: Panellists from different fields (%) Panellist Field GEN ST NA SC Can’t Say OBC Academia 52.4 0.8 29 2.9 Appearances 5.2 9.4 Academia 55.7 1.6 18 Panellists 4.6 7.7 13 Bar And Bench 40.5 0.1 51 2.2 Appearances 1.3 4.9 Bar And Bench 60.6 0.2 21 Panellists 4.4 4.8 8.6 Bureaucrat 64.3 0.8 8.4 Appearances 6.1 13.1 7.3 Bureaucrat 64 0.8 9.8 4 Panellists 13.4 8 Business 84.5 0.1 Appearances 6.2 9.2 Business 83.8 0.2 6.6 Panellists 9.5 Defence Expert 82.3 0.1 2.1 Appearances 7.7 1.8 5.9 Defence Expert 74.3 0.2 3.9 Panellists 7.2 6.5 7.8 Financial Expert 69.6 2.4 Appearances 13 6.3 9.1 Financial Expert 67.6 3.3 Panellists 12 9.1 7.6 Independent Expert 48.7 0.5 30 Appearances 8.5 6.8 5.3 Independent Expert 55.7 0.7 19 Panellists 8.6 9.9 6.3 Media 75.6 0.5 7.4 Appearances 5.7 3.3 7.5 Media 72.2 0.3 6.1 Panellists 6.6 6.1 8.6 NGO and CSO 44.9 0.1 32 Appearances 1.3 20 1.6 NGO and CSO 53.7 0.4 17 Panellists 5.8 16 6.7 Party Spokespersons 70.8 1.7 17 Appearances 2.2 3.8 4.7 Party Spokespersons 60.5 0.5 15 Panellists 4 10.7 8.9 Political Analyst 52.5 0.1 18 Appearances 17 5.3 7.3 Political Analyst 58.1 0.1 21 Panellists 6.1 8.8 6.3 Religious 43.4 0.3 11 Appearances 25 10.1 10 Religious 48.4 0.3 13 Panellists 13 16.9 8.8 Social Activist 37.1 2.7 44 Appearances 4.1 6.7 5 Social Activist 42.6 1.8 30 Panellists 7 8.6 10 Think Tank 89.7 0.1 Appearances 2.5 3.8 3.8 Think Tank 79.7 0.1 Panellists 3.3 10 6.9
17 | WHO TELLS OUR STORIES MATTERS FIGURE 7: Topics discussed by panellists (%) 74.4 6.1 0.2 4.1 5.1 10.2 Business and Economy Appearances 69.7 6.0 0.2 5.0 6.4 12.8 Panellists 63.7 3.7 1.2 6.8 21.8 2.7 Crime And Accident Appearances 61.3 4.2 1.7 6.9 24.1 1.9 Panellists 56.0 4.5 2.0 37.5 Culture And Entertainment Appearances 56.0 4.5 2.0 37.5 Panellists 67.5 5.3 1.0 4.8 15.2 6.1 Defence And National Security Appearances 57.3 5.6 1.2 6.6 22.9 6.5 Panellists 84.1 6.6 0.4 8.8 Environment And Energy Appearances 86.5 5.6 0.4 7.4 Panellists 67.7 4.2 2.6 2.9 14.6 7.9 International Affairs Appearances 66.0 3.6 2.2 3.5 16.5 8.2 Panellists 64.6 4.4 1.1 5.1 19.3 5.5 Politics Appearances 59.1 5.3 0.6 8.0 16.3 10.6 Panellists 7.0 52.1 6.0 0.2 24.4 10.3 Public Life Appearances 53.5 7.0 0.2 8.6 19.0 11.6 Panellists 63.1 23.0 12.0 2.4 Science And Technology Appearances 63.1 2.4 23.0 12.0 Panellists 60.2 9.6 1.2 13.2 15.8 Sports Appearances 60.2 9.6 13.2 15.8 1.2 Panellists 65.4 5.1 1.2 6.9 16.4 5.1 State And Policy Appearances 64.3 5.8 0.7 7.8 15.1 6.3 Panellists 0% 20% 40% 60% 80% 100% GEN SC ST OBC NA CAN’T SAY
Hindi Television News | 18 FIGURE 8: Panellists debating caste issues (%) 100 9.5 12.5 15.4 13.6 9.3 12.5 9.3 0.1 1.4 89.2 14.3 6.7 9.3 6.3 12.5 9.1 7.7 80 9.9 5.5 12.2 1.8 4.1 68.8 8.2 0.2 4.4 75.0 0.2 1.7 69.4 1.2 2.0 68.5 0.3 5.7 58.8 60 63.4 (Percentage) 40 20 0 Aaj Tak News 18 India India TV NDTV India Rajya Sabha TV Zee News Total GEN SC ST OBC NA CAN’T SAY
19 | WHO TELLS OUR STORIES MATTERS English newspapers Nearly 92% of the newsroom leadership positions across the English newspapers selected for this study – The Economic Times, Hindustan Times, The Hindu, The Indian Express, The Telegraph, The Times of India – were held by upper caste individuals, with no representation for the Scheduled Castes, Scheduled Tribes, OBCs, or religious minorities. (Figure 1) We categorised the nearly 16,000 pieces analysed for this study under 11 topics, and found that upper caste writers accounted for 55%-65% of the articles under each topic. Their share might actually be higher given that we were unable to identify about a fifth of all writers by caste. (Figure 5) The Indian Express paid the most attention to caste issues, accounting for 60% of all articles on the topic. The daily mentioned caste in both news stories and opinion pieces, although analysing the actual content of the articles was beyond the scope of this study. (Figure 6) We studied over 16,000 articles carried by the six newspapers between October 2018 and March 2019, sifting out around 3,000 bylined articles from each except The Economic Times and The Telegraph. The former, being a financial publication, did not have a dedicated economy page. The latter carried a lot of articles, especially on sports pages, by foreigners who were excluded from our caste analysis. FIGURE 1: Leadership Positions (%) 8.3% In each of these newspapers except The Hindu, over 60% of the articles were by upper caste writers. The Hindu seems to be bucking the trend because we were unable to determine the castes of nearly 26% of its writers. Across the seven newspapers, we were unable to assign a caste to nearly a fifth of the writers. (Figure 2) GEN SC 91.7% ST OBC NA CAN’T SAY Not counting members of religious minorities and those whose caste identities could not be determined, we found that 80% of the top decile of writers by the number of articles published were upper caste, with the figure rising to 96% in The Economic Times. (Figure 3) All four types of pages analysed for this study were dominated by upper caste writers. They bylined 72% of business page articles and 62% of front page stories. (Figure 4)
English Newspapers | 20 FIGURE 2: Overall caste composition (%) 66.6 4.2 0.8 4.9 10.6 12.9 Hindustan Times Appearances 57.5 17.3 8.2 0.8 6.5 7.9 Panellists 4.5 14.3 5.6 1.1 70.1 4.5 The Economic Times Appearances 57.8 22.6 7.7 1.2 5.1 5.6 Panellists 52.1 5.3 0.5 7.4 8.6 26.1 The Hindu Appearances 7.0 0.4 10.0 26.2 46.3 10.0 Panellists 58.1 5.5 0.5 5.4 13.4 17.1 The Indian Express Appearances 6.7 0.7 8.4 19.4 53.4 11.5 Panellists 3.8 0.1 7.4 5.5 71.6 11.7 The Telegraph Appearances 68.5 6.3 0.2 7.3 4.9 12.9 Panellists 2.9 0.3 3.8 17.6 65.6 9.9 The Times of India Appearances 53.8 5.1 0.9 7.4 9.4 23.6 Panellists 4.4 0.5 5.5 17.2 62.1 10.2 TotaL Appearances 6.2 0.7 8.3 21.7 53.9 9.2 Panellists 0% 20% 40% 60% 80% 100% GEN SC ST OBC NA CAN’T SAY
21 | WHO TELLS OUR STORIES MATTERS FIGURE 3: Top decile of writers by the number of articles published (%) 100 16.0 7.7 21.0 12.9 4.8 16.4 9.6 19.0 4.0 1.3 0.4 17.1 9.0 3.3 0.1 80 9.7 2.4 0.2 3.1 1.7 76.6 2.9 0.5 8.8 3.5 63.9 3.0 69.1 76.2 7.3 0.5 5.4 61.1 60 6.0 69.1 (Percentage) 40 20 0 The Economic Times Hindustan Times The Hindu The Indian Express The Telegraph The Times of India GEN SC ST OBC NA CAN’T SAY FIGURE 4: Caste composition by page (%) Can’t Say OBC SC NA ST GEN Page Title 11.9 3.7 4.7 7.7 0.2 71.8 Business Appearances 18.6 8.7 5.8 7.2 0.8 58.9 Business Panellists 12.4 6.3 4.3 14.4 0.3 62.3 Front Page Appearances 17.2 8.2 5.9 11.4 0.6 56.6 Front PagE Panellists 17.8 6.9 5.3 9.3 0.9 59.8 Opinion Appearances 22.1 8 6.5 9 0.7 53.7 Opinion Panellists 25.5 4.7 3.6 8 0.6 57.6 Sports Appearances 25.5 6.3 5.2 8.1 1.2 53.7 Sports Panellists
English Newspapers | 22 FIGURE 5: Composition by topic (%) 70.3 4.7 0.3 4.1 8.1 12.4 Business and Economy Appearances 60.5 5.8 0.8 8.2 6.9 17.7 Panellists 63.1 5.6 0.4 8.8 13.5 8.5 Crime And Accident Appearances 58.8 6.0 0.6 8.0 13.1 13.4 Panellists 59.8 5.4 5.8 11.6 16.7 0.7 Culture And Entertainment Appearances 57.0 6.4 6.2 11.1 18.4 0.9 Panellists 59.3 3.6 0.2 4.7 24.0 8.3 Defence And National Security Appearances 60.6 4.6 0.2 6.2 14.7 13.6 Panellists 62.9 7.9 0.3 8.5 6.3 14.1 Environment And Energy Appearances 57.0 8.4 0.3 8.3 7.1 18.9 Panellists 66.4 2.9 0.7 4.8 13.1 12.1 International Affairs Appearances 56.8 5.3 0.6 6.9 12.3 18.0 Panellists 58.6 5.1 0.3 7.2 15.1 13.8 Politics Appearances 57.2 6.5 0.5 8.1 10.9 16.8 Panellists 7.7 56.6 5.7 1.4 10.0 18.6 Public Life Appearances 55.0 9.7 20.1 6.2 0.5 8.6 Panellists 54.1 6.4 0.3 6.3 10.1 22.8 Science And Technology Appearances 58.5 8.1 8.1 19.1 5.9 0.3 Panellists 57.6 3.6 0.7 4.7 7.9 25.4 Sports Appearances 25.2 54.7 5.3 6.5 7.1 1.1 Panellists 63.8 4.0 0.3 5.9 10.1 15.8 State And Policy Appearances 57.9 5.4 0.5 7.3 10.0 18.9 Panellists 0% 20% 40% 60% 80% 100% GEN SC ST OBC NA CAN’T SAY
23 | WHO TELLS OUR STORIES MATTERS FIGURE 6: Composition of writers on caste issues (%) 100 44.4 46.2 20.0 23.3 100 13.9 100 86.1 80 14.5 11.1 6.2 6.3 0.2 7.5 60 0.1 8.7 (Percentage) 11.1 7.7 50.4 51.6 6.3 1.1 4.4 34.3 3.4 0.1 40 15.5 24.4 20 0 The Economic Times Hindustan Times The Hindu The Indian Express The Telegraph The Times of India Total GEN SC ST OBC NA CAN’T SAY
Hindi Newspapers | 24 Hindi Newspapers Not one Dalit, Adivasi or OBC journalist held a leadership position across the seven Hindi newspapers chosen for this study – Dainik Bhaskar, Amar Ujala, Navbharat Times, Rajasthan Patrika, Prabhat Khabar, Punjab Kesari, and Hindustan4. (Figure 1) Around 76% of the articles in Navbharat Times and 90% in Rajasthan Patrika that discussed caste issues were by upper caste writers. We found only a few bylined articles on caste issues in Hindi newspapers, and most of them were categorised under ‘Crime and Accident’ and ‘State and Policy’ heads. That the period of this study coincided with the government’s decision to give reservation to Economically Weaker Sections in the General Category could explain the greater coverage of matters related to State and Policy. (Figure 6) A substantial number of the articles were not bylined, so they could not be considered for our caste analysis. The Hindi newspapers fared slightly better than the English dailies in representing marginalised groups. Nearly 12% of the articles in Punjab Kesari and Rajasthan Patrika were by writers belonging to the Scheduled Castes. (Figure 2) FIGURE 1: Leadership Positions 12.5% Nearly 20% of the writers in the top decile, by the number of articles published, belonged to the Scheduled Castes, Schedule Tribes, and OBCs. (Figure 3) GEN SC ST OBC NA CAN’T SAY 87.5% Around 58% of the writers whose bylines appeared on the sports pages were upper caste, and they wrote 80% of the articles. Not a single writer from a religious minority found space on the sports pages of any of the newspapers. The business pages too were dominated by upper caste writers. (Figure 4) Nearly half of the bylined articles across the seven newspapers were categorised under the topics of Politics and Public Life, and around 60% of these were by upper caste writers. Of the rest, the castes of a substantial number of writers could not be ascertained. (Figure 5) 4 Data Not available for Navbharat Times and Dainik Bhaskar
25 | WHO TELLS OUR STORIES MATTERS FIGURE 2: Overall caste composition (%) 62.6 5.7 0.5 10.5 6.1 14.6 Amar Ujala Appearances 6.7 5.9 0.8 8.7 24.5 53.4 Panellists 68.2 7.4 0.3 10.6 3.1 10.4 Dainik Bhaskar Appearances 9.6 4.5 0.4 11.6 17.8 56.2 Panellists 61.1 6.7 1.4 7.4 3.9 19.6 Hindustan Appearances 6.5 8.1 1.1 8.5 18.2 57.6 Panellists 68.0 5.4 0.2 9.8 6.3 10.2 Navbharat Times Appearances 6.8 6.7 0.2 10.1 11.7 64.4 Panellists 59.5 7.8 2.8 9.3 7.9 12.8 Prabhat Khabar Appearances 9.2 6.8 3.8 11.2 11.8 57.2 Panellists 49.8 11.8 0.3 12.1 9.6 16.4 Punjab Kesari Appearances 11.9 5.6 0.4 12.1 19.2 50.8 Panellists 66.5 11.9 1.9 9.2 2.4 8.2 Rajasthan Patrika Appearances 4.7 4.7 1.9 9.3 13.5 65.9 Panellists 60.3 8.3 0.9 10.1 6.3 14.1 TOTAL Appearances 8.1 6.5 1.1 9.7 18.4 56.2 Panellists 0% 20% 40% 60% 80% 100% GEN SC ST OBC NA CAN’T SAY
Hindi Newspapers | 26 FIGURE 3: Top decile of writers by the number of articles published (%) 100 7.1 4.9 2.4 17.1 19.6 7.5 5.0 9.7 8.9 15.0 4.3 9.1 7.1 4.4 0.2 8.8 11.0 8.6 5.0 2.2 6.7 0.7 6.4 64.5 0.2 6.0 80 0.4 8.2 0.1 5.6 71.4 12.4 77.5 2.5 8.8 71.7 0.1 66.9 64.3 9.7 60 (Percentage) 57.8 40 20 0 Amar Ujala Dainik Bhaskar Hindustan Navbharat Times Prabhat Khabar Punjab Kesari Rajasthan Patrika GEN SC ST OBC NA CAN’T SAY FIGURE 4: Caste composition by page (%) Can’t Say OBC SC NA ST GEN Page Title 20.5 10 3.5 4.7 0.2 61.1 Business Appearances 15.3 6.9 5.9 7.9 0.4 63.7 Business Panellists 12 11.6 12.7 13.3 0.3 50.2 Front Page Appearances 14.3 13.7 11.9 3.6 0.4 56.2 Front PagE Panellists 14.1 10.1 8 5.2 1.2 61.5 Opinion Appearances 19 9 7.4 7.4 1.4 55.8 Opinion Panellists 9.3 5.1 5.6 0.3 79.7 Sports Appearances 24.2 8.2 9.3 0.6 57.7 Sports Panellists
27 | WHO TELLS OUR STORIES MATTERS FIGURE 5: Composition by topic (%) 61.0 4.4 0.3 11.7 3.7 19.0 Business and Economy Appearances 62.8 7.0 0.4 9.1 6.3 14.3 Panellists 51.3 16.3 1.2 14.0 3.4 13.7 Crime And Accident Appearances 51.6 14.2 0.9 13.6 2.7 17.0 Panellists 58.1 7.0 9.9 5.3 18.1 1.6 Culture And Entertainment Appearances 55.5 7.4 10.1 6.9 18.1 1.9 Panellists 37.8 9.7 0.4 8.3 27.8 16.0 Defence And National Security Appearances 51.9 13.0 0.5 13.4 4.8 16.4 Panellists 53.9 7.8 0.4 8.6 16.3 12.9 Environment And Energy Appearances 54.8 10.4 0.4 10.5 7.6 16.3 Panellists 60.8 8.1 1.7 7.3 8.3 13.8 International Affairs Appearances 58.8 5.5 2.2 6.6 6.7 20.1 Panellists 61.7 8.4 0.4 11.9 6.4 11.2 Politics Appearances 62.2 7.6 0.7 9.9 6.5 13.2 Panellists 9.2 61.4 8.3 1.2 3.4 16.5 Public Life Appearances 55.7 5.7 20.1 7.1 1.6 9.9 Panellists 62.7 7.9 0.2 7.2 10.1 11.9 Science And Technology Appearances 54.2 8.4 9.5 17.6 10.1 0.2 Panellists 78.1 6.6 0.8 6.0 0.6 7.9 Sports Appearances 19.8 54.5 11.8 9.9 2.3 1.7 Panellists 60.7 10.2 1.1 11.2 7.8 8.9 State And Policy Appearances 61.6 8.4 1.4 10.6 6.6 11.5 Panellists 0% 20% 40% 60% 80% 100% GEN SC ST OBC NA CAN’T SAY
Hindi Newspapers | 28 FIGURE 6: Composition of writers on caste issues (%) 100 100 28.8 50.0 5.6 16.7 17.6 14.8 10.4 89.6 0.4 8.6 76.2 7.8 80 10.0 11.9 16.6 11.8 4.4 6.4 60 3.7 0.3 10.2 (Percentage) 8.3 52.3 51.8 44.3 13.0 40 0.8 4.4 20 23.4 0 Amar Ujala Dainik Bhaskar Hindustan Navbharat Times Prabhat Khabar Rajasthan Patrika Total GEN SC ST OBC NA CAN’T SAY
29 | WHO TELLS OUR STORIES MATTERS Digital Media Eleven news websites were chosen for this study, Firstpost, Newslaundry, Scroll.in, Swarajya, The Ken, The News Minute, The Print, The Quint, and The Wire publish in English, and Newslaundry (Hindi) and Satyagrah in Hindi. In absolute terms, digital media carried the highest number of articles by non-upper caste contributors. That, however, was because of the sheer volume of the content. In relative terms, the news websites fared no better than newspapers or TV news channels. No more than 2% of the contributors to The Ken belonged to the Scheduled Castes and the Scheduled Tribes. The figure did not cross 9% for any of the websites. (Figure 2) As in the other media, the majority of the leadership roles across these digital outlets were occupied by upper caste journalists. (Figure 1) Although in case of news websites, we limited our analysis to contributors who wrote at least five articles during the six months under consideration, we were able to collect a wealth of data. Given the nature of the digital medium, we found that names of many writers were not standardised across outlets. For example, Meghnad Sahasrabhojanee, who wrote frequently for Newslaundry, was identified as Meghnad S by some other outlets. We standardised such names to the extent possible, but might have missed a few owing to the sheer volume of the content. A substantial proportion of the writers could not be identified by caste. Upper caste contributors did most of the writing on caste issues. In Satyagrah, three out of every four contributors writing on caste issues were upper caste. (Figure 5) FIGURE 1: Leadership Positions 10.5% 5.3% GEN SC All writers in the top decile by the number of articles published in The Ken, Newslaundry, Newslaundry (Hindi), and Satyagrah were upper caste. (Figure 4) ST OBC NA CAN’T SAY 84.2% As in print and broadcast media, writers from the Scheduled Tribes were almost completely absent. We had assumed that since the barriers for entry were lower in digital media – most outlets employ small teams of staffers and get the bulk of their content from freelance writers, students, activists – we would find more contributors belonging to the Scheduled Tribes than in newspapers and on TV. That did not turn out to be the case.
Digital Media | 30 FIGURE 2: Overall caste composition (%) 56.9 3.0 0.6 9.0 6.3 24.3 First Post Appearances 4.5 0.7 8.4 23.1 56.3 7.1 Panellists 69.5 2.0 1.0 4.4 10.0 13.2 Newslaundry Appearances 48.9 4.0 2.4 10.2 15.5 19.1 Panellists 76.7 6.2 0.1 10.7 3.9 2.4 Newslaundry (Hindi) Appearances 60.0 8.8 0.3 14.0 6.5 10.4 Panellists 5.8 79.3 0.2 9.0 2.0 3.7 Satyagrah Appearances 6.5 68.0 0.3 12.6 6.3 6.3 Panellists 62.4 3.4 0.7 6.2 10.7 16.6 scroll.in Appearances 62.7 4.7 1.0 8.6 13.8 9.2 Panellists 56.8 3.1 0.2 7.1 2.2 30.5 Swarajya Appearances 52.3 5.7 0.4 8.8 31.3 1.4 Panellists 59.2 1.2 0.1 13.0 10.8 15.8 The Ken Appearances 44.8 1.5 0.2 10.7 28.6 14.3 Panellists 41.4 3.0 14.5 8.6 32.5 The News Minute Appearances 40.7 2.4 3.5 46.7 6.7 Panellists 72.5 3.1 0.4 5.3 6.7 11.9 The Print Appearances 62.1 5.0 0.5 8.0 9.4 15.0 Panellists 54.7 3.0 0.1 4.7 11.7 25.9 The Quint Appearances 57.1 4.2 0.1 5.5 20.4 12.7 Panellists 55.7 4.7 0.1 5.1 16.4 17.9 The Wire Appearances 56.2 4.0 0.2 5.8 16.8 16.8 Panellists 60.1 3.3 0.4 7.7 8.2 20.3 TOTAL Appearances 54.9 5.0 0.7 8.6 21.9 8.9 Panellists 0% 20% 40% 60% 80% 100% GEN SC ST OBC NA CAN’T SAY
31 | WHO TELLS OUR STORIES MATTERS FIGURE 3: Composition by topic (%) 54.8 5.1 0.7 15.7 9.5 14.2 Business and Economy Appearances 5.0 0.6 7.9 20.8 58.9 6.9 Panellists 63.9 2.8 0.4 4.4 7.4 21.1 Crime And Accident Appearances 59.2 3.8 0.5 7.2 19.5 9.7 Panellists 58.0 3.7 0.1 9.5 5.7 22.9 Culture And Entertainment Appearances 59.2 4.0 0.3 8.1 10.0 20.7 Panellists 57.2 1.9 0.2 4.9 26.6 9.0 Defence And National Security Appearances 63.3 4.0 0.3 7.2 12.6 12.6 Panellists 66.1 1.9 0.4 6.1 9.1 16.4 Environment And Energy Appearances 60.0 3.6 0.5 8.3 19.7 7.9 Panellists 66.7 2.1 0.1 6.0 13.5 11.6 International Affairs Appearances 56.6 3.7 0.2 7.3 19.7 12.4 Panellists 66.7 4.2 0.3 6.7 5.4 16.7 Politics Appearances 58.5 4.7 0.4 8.9 6.9 20.6 Panellists 56.2 3.2 0.3 4.9 8.8 26.0 Public Life Appearances 55.9 5.0 0.6 8.7 20.4 9.3 Panellists 24.7 0.6 1.1 19.3 15.5 38.8 Science And Technology Appearances 52.8 3.3 0.5 7.2 27.4 8.9 Panellists 55.5 2.4 0.5 3.6 4.6 33.4 Sports Appearances 59.1 3.4 0.4 6.7 25.2 5.2 Panellists 71.3 3.3 0.3 6.3 7.3 11.4 State And Policy Appearances 61.0 5.2 0.7 7.6 7.4 18.1 Panellists 0% 20% 40% 60% 80% 100% GEN SC ST OBC NA CAN’T SAY
Digital Media | 32 FIGURE 4: Top decile of writers by the number of articles published (%) 100 9.5 8.3 28.6 50.0 7.1 7.1 4.4 21.1 25.0 25.0 100 100 100 4.8 91.7 11.9 0.8 2.7 80 8.3 15.8 0.3 2.4 71.1 12.5 4.8 7.3 0.1 3.8 55.4 77.9 1.7 2.7 10.1 53.9 1.6 60.9 0.1 1.6 59.8 60 (Percentage) 25.0 40 25.0 20 0 First Post News- laundry News- laundry (Hindi) Satya- grah Swarajya The Ken The News Minute The Print The Quint The Wire scroll.in GEN SC ST OBC NA CAN’T SAY FIGURE 5: Composition of writers on caste issues (%) Can’t Say OBC SC NA ST GEN Page Title 13.3 19.5 5.0 13.3 0.2 First Post 48.6 44.4 1.6 4.8 49.2 Newslaundry 25.7 20.3 0.6 53.4 Newslaundry (Hindi) 11.8 13.3 0.5 74.4 Satyagrah 13.3 33.3 1.9 0.1 51.4 Swarajya 33.3 0.7 6.7 13.3 46.0 The News Minute 8.7 7.4 5.8 0.6 8.7 68.9 The Print 28.6 14.3 0.0 57.1 The Quint 20.0 9.6 0.7 0.0 6.7 63.0 The Wire 17.6 1.3 1.9 0.1 29.4 49.5 scroll.in 18.9 9.7 5.6 0.2 9.8 Total 55.8
33 | WHO TELLS OUR STORIES MATTERS Magazines For this study, we chose 12 magazines covering a range of interests, from Politics and Business to Culture and Sports – Business Today, Caravan , Femina, Frontline, India Today, India Today (Hindi), Organsier, Outlook, Outlook (Hindi) , Sarita, Sportstar, and Tehelka. Around 44% of the articles on International affairs were by writers belonging to religious minorities, with Frontline and Outlook alone accounting for a third of them. Over six months until March 2019, there were only three cover stories on subjects related to Science and Technology. (Figure 3) Compared to newspapers, TV news channels, and news websites, the OBCs were better represented in the leadership positions of magazines. But, again, there was no place for the Scheduled Castes and the Scheduled Tribes. (Figure 1) Only four of the magazines – India Today, India Today (Hindi), Caravan and Sarita – gave any space to caste issues on their cover pages. (Figure 5) FIGURE 1: Leadership Positions Just a 10th of the writers in the top decile by the number of articles published belonged to the Scheduled Castes, Scheduled Tribes, and OBCs. In case of Tehelka, though, the top decile was entirely upper caste. (Figure 4) 13.6% GEN 13.6% Though Caravan appeared to be an exception to this pattern of upper caste dominance, the fact that we could not assign a caste to over a quarter of its writers meant it was difficult to say this with certainty. Of the 972 articles that we analysed across the 12 magazines, fewer than 0.5 % were written by members of the Scheduled Tribes. (Figure 2) SC ST OBC NA CAN’T SAY 72.7% 5 For the most part, Outlook and Outlook (Hindi) published the same articles in, respectively, English and Hindi languages. But since we only considered the lead story and the articles highlighted on the cover page of each edition, and they were different in many instances, data for the two magazines vary.
Magazines | 34 FIGURE 2: Overall caste composition (%) 5.6 11.8 15.8 62.0 4.5 0.2 Business Today Appearances 60.6 0.2 8.7 6.1 18.2 6.2 Panellists 12.8 14.8 25.9 38.8 7.5 0.2 Caravan Appearances 36.9 0.2 12.8 15.4 26.9 7.8 Panellists 4.5 1.7 33.9 57.1 2.8 Femina Appearances 47.4 0.1 5.9 4.5 36.4 5.6 Panellists 0.2 8.5 16.7 14.3 56.2 4.2 Frontline Appearances 58.1 0.1 6.2 14.3 19.0 2.3 Panellists 4.4 6.1 12.9 73.3 3.2 India Today Appearances 64.0 2.8 17.9 12.8 2.4 Panellists 72.0 3.4 0.1 4.5 7.1 12.9 India Today (Hindi) Appearances 3.8 0.1 4.9 12.5 59.9 18.8 Panellists 54.2 10.3 0.3 8.8 1.1 12.9 Organiser Appearances 8.3 0.2 7.6 12.5 53.8 1.6 Panellists 52.3 8.4 1.2 7.8 15.5 14.9 Outlook Appearances 8.4 1.8 7.9 24.2 45.6 12.1 Panellists 52.2 10.9 1.3 16.0 8.7 10.9 Outlook (Hindi) Appearances 13.0 1.8 13.8 12.1 51.7 7.6 Panellists 57.9 9.3 0.3 12.8 13.1 6.6 Sarita Appearances 8.4 0.8 14.2 10.0 57.1 10.0 Panellists 52.0 3.7 0.1 5.5 5.3 33.3 Sportstar Appearances 4.0 0.1 5.9 35 47.5 7.5 Panellists 57.2 6.0 0.1 8.7 20.0 8.0 Tehelka Appearances 7.0 0.1 12.4 7.1 44.7 28.6 Panellists 55.9 6.1 0.4 7.7 9.2 16.8 TOTAL Appearances 7.2 0.5 8.8 21.1 52.2 10.2 Panellists 0% 20% 40% 60% 80% 100% GEN SC ST OBC NA CAN’T SAY
35 | WHO TELLS OUR STORIES MATTERS FIGURE 3: Composition by topic (%) 0.2 14.6 7.2 8.4 8.3 61.3 Business and Economy Appearances 61.6 2.3 20.5 7.0 0.2 8.5 Panellists 0.3 7.1 17.9 10.6 7.1 57.0 Crime And Accident Appearances 58.7 7.7 7.7 16.7 0.2 9.0 Panellists 7.3 0.1 7.8 10.4 67.3 7.1 Culture And Entertainment Appearances 10.2 60.3 13.6 8.0 0.1 7.8 Panellists 0.2 18.4 6.0 11.8 58.0 5.5 Defence And National Security Appearances 12.5 57.2 14.6 9.2 0.3 6.2 Panellists 0.2 11.1 17.2 11.1 51.9 8.4 Environment And Energy Appearances 51.9 11.1 11.1 17.2 0.2 8.4 Panellists 0.1 13.0 3.7 43.5 31.5 8.2 International Affairs Appearances 37.5 30.6 18.8 5.3 0.1 7.8 Panellists 1.1 15.4 5.6 5.6 64.1 8.3 Politics Appearances 8.0 55.3 17.7 8.3 1.3 9.4 Panellists 22.9 6.1 0.2 10.6 52.9 7.3 Public Life Appearances 51.9 11.4 22.2 6.6 7.7 Panellists 66.7 33.3 Science And Technology Appearances 50.0 50.0 Panellists 30.8 3.3 0.1 6.2 54.4 5.3 Sports Appearances 8.7 49.6 32.6 3.5 0.1 5.5 Panellists 8.2 5.8 0.2 8.9 67.8 9.1 State And Policy Appearances 10.1 59.1 10.1 7.9 0.3 12.4 Panellists 0% 20% 40% 60% 80% 100% GEN SC ST OBC NA CAN’T SAY
Digital Media | 36 FIGURE 4: Top decile of writers by the number of articles published (%) 100 1.1 12.0 86.9 100.0 25.0 50.0 33.3 25.0 25.0 20.0 25.0 11.1 33.3 20.0 11.1 0.4 23.2 80 0.1 13.0 80.0 0.1 12.5 1.7 1.7 1.7 1.7 25.9 0.3 5.5 6.7 0.4 10.8 11.9 71.7 71.7 13.9 0.9 61.6 60 0.3 2.4 49.4 (Percentage) 15.9 10.4 54.3 50.0 50.7 45.0 40 40.6 20 0 Business Today Caravan Femina Frontline India Today India Today (Hindi) Organiser Outlook Outlook (Hindi) Sarita Sportstar Tehelka GEN SC ST OBC NA CAN’T SAY FIGURE 5: Composition of writers on caste issues (%) Page Title GEN ST NA SC OBC Can’t Say Caravan 67.1 25.0 17.9 25.0 25.0 India Today 66.1 0.1 0.5 33.3 India Today (Hindi) 99.5 0.5 Sarita 63.0 9.4 27.5 Total 36.2 12.5 10.1 16.1 25.0
37 | WHO TELLS OUR STORIES MATTERS Remarks The untouchables have no press.” “ - BR Ambedkar, 1938 This report provides empirical evidence for the oft- repeated observation that the Indian news media reflects the world view of a small minority of the population – the upper castes – even as it claims to speak for everyone. Our study shows that the Dalits, Adivasis, and Other Backward Classes are grossly underrepresented in both the work and the workplaces of newspapers, television news channels, news websites, and magazines. If, that is, they are not entirely absent. Speaking with journalists and representatives of media houses for this report, we found that while almost everyone recognised that people from marginalised communities were underrepresented in India’s newsrooms, some argued that talking about caste and studying caste inequality would somehow exacerbate casteism! We hope this report will serve as a preliminary step towards recognising the problem, and spur further research to quantify the representation of marginalised groups in the Indian media. This means that for the mainstream media and digital portals analysed in this report, the vast majority of the country’s population is a ‘subject’ of news created by upper caste individuals and groups, rather than a news creator or messenger. In this, the Indian media today is not unlike the American media of the 1960s which the Kerner Commission criticised for neglecting African American voices and seeing the world “with white men’s eyes and white perspective”. It is an untenable situation, not least because the privileging of upper caste viewpoints in the shaping of national discourses undermines the democratic character of the Indian society. It is time media organisations took steps, including affirmative action, to diversify newsrooms in line with the country’s social and demographic character. To this end, systems to encourage inclusion must be put in place, and concerted efforts made to train and hire journalists from across the social spectrum.
Appendix | 38 Appendix 1: Sources English TELEVISION News Channels & Debate Shows Hindi TELEVISION Channels & Debate Shows Newspapers English • Hindustan Times (Mumbai) • The Economic Times (Mumbai) • The Hindu (Chennai) • The Indian Express (Delhi) • The Telegraph (Kolkata) • The Times of India (Mumbai) • CNN-News 18 Face Off Tonight; Viewpoint • Aaj Tak Halla Bol; Dangal • News18 India Aar Paar • India Today News Today • India TV Kurukshetra • Mirror Now The Urban Debate • NDTV India Prime Time; Ranneeti • NDTV 24x7 Left, Right and Centre; Reality Check • Rajya Sabha TV Desh Deshantar • Rajya Sabha TV The Big Picture; India’s World Hindi • Amar Ujala (Lucknow) • Dainik Bhaskar (Patna) • Hindustan (Delhi) • Navbharat Times (Delhi) • Prabhat Khabar (Ranchi) • Punjab Kesari (Ludhiana) • Rajasthan Patrika (Jaipur) • Republic Bharat6 Poochta Hai Bharat • Zee News Taal Thok Ke • Republic TV Late Tonight; The Debate • Times Now The News Hour Magazines • Business Today • Caravan • Femina • Frontline • India Today • India Today (Hindi) • Organiser • Outlook • Outlook (Hindi) • Sarita • Sportstar • Tehelka Digital Media • Firstpost • Newslaundry • Newslaundry (Hindi) • Satyagrah • Scroll.in • Swarajya • The Ken • The News Minute • The Print • The Quint • The Wire 6 Data only for February and March as the channel was launched in February 2019.
39 | WHO TELLS OUR STORIES MATTERS Appendix 2: Qualitative Heads Below are the qualitative heads used to analyse the data. The topics under each head are descriptive and not exhaustive. 1. Business and Economy: Macroeconomic indicators, financial markets, individual businesses, domestic and global trade. 2. Crime and Accident: Rioting, murder, communal violence, lynching, sexual harassment, rape, accident, building collapse, fire. 3. Culture and Entertainment: Film, music, art, dance, books, authors, literary awards, reviews, art and literary festivals. 4. Defence and National Security: War, conflict, armed forces, insurgency, Naxalism, terrorism. 5. Environment and Energy: Climate change, weather, wildlife, plants, earth science, renewable energy, fossil fuels, environmental science research. 6. International Affairs: All foreign news, Indian diplomatic affairs. 7. Politics: Parties, elections, statements by politicians. 8. Public Life: Protests, demonstrations, rights movements, social unrest, daily life, media, journalism. 9. Science and Technology: Inventions, discoveries, science explainers, communications technology, artificial intelligence, machine learning. 10. Sports: All sports, sports organisations, doping, scandals. 11. State and Policy: Agriculture, rural affairs, urban affairs, education, healthcare, transport, bureaucracy, transfers and recruitment, ministries, judiciary.
Appendix | 40 Appendix 3: Fields of panellists The fields used to categorise TV panellists are: 1. Academia 2. Business 3. Bureaucrat 4. Bar and Bench 5. Defence Expert (including retired armed forces personnel) 6. Financial Expert 7. Independent Expert (environmentalists, medical doctors, sportspersons, film directors, writers) 8. Media 9. NGO and CSO (belonging to a non-governmental organisation or a civil society group) 10. Political Analyst (only political analysts, not party spokespersons) 11. Party Spokespersons 12. Religious Expert (spiritual gurus, heads of religious denominations) 13. Social Activists 14. Think Tank
41 | WHO TELLS OUR STORIES MATTERS Appendix 4: Questionnaire Hi, We are conducting a research study for The Media Rumble project in collaboration with Oxfam and UN Women. The report will be presented at The Media Rumble 2019 to be organised in August by TeamWork Arts and Newslaundry. We are collecting demographic information from journalists, reporters and media persons to analyse the representation of gender, geography, caste and age in news and media platforms. It would be great if you could help us by answering a few questions for our survey. (The data we collect will be kept confidential.) Name: Age: 18-30 years | 30-45 years | 45 years + | Can’t say Educational qualification: Diploma | Graduate | Postgraduate | PhD Organisation: Designation: Work experience (rough estimate in years): Gender (born as): Male | Female | Transgender | Other Gender (you identify with): Male | Female | Transgender | Other Caste (born into): Upper Caste/General | OBC | SC | ST Caste (you identify with): Upper Caste/General | OBC | SC | ST Religion (given at birth): Hindu | Muslim | Sikh | Jain | Christian | Atheist | Other Religion (you identify with): Hindu | Muslim | Sikh | Jain | Christian | Atheist | Other Place of birth: City or Urban | Rural Current residence: City or Urban | Rural Name of your immediate boss: Did you have access to 50 books at home when you were growing up? Yes | No How often do you use public transport? Almost always | Fairly enough | Almost never Where did you complete your highest level of education from? Metro | Non-Metro Urban | Rural | Abroad Did you ever have to take a loan for your education? Yes | No
This publication is copyright but the text may be used free of charge for the purposes of advocacy, campaigning, education, and research, provided that the source is acknowledged in full. The copyright holder requests that all such use be registered with them for impact assessment purposes. For copying in any other circumstances, or for re-use in other publications, or for translation or adaptation, permission must be secured and a fee may be charged. Email: communication@oxfamindia.org This information in this publication is correct at the time of going to press. About Oxfam India Oxfam India, a fully independent Indian organisation, is a member of an international confederation of 19 organisations. The Oxfams are rights based organisations, which fight poverty and injustice by linking grassroot interventions to local, national and global policy developments.
45 | WHO TELLS OUR STORIES MATTERS Oxfam India Newslaundry Teamwork Arts 4th and 5th Floor, Shriram Bharatiya Kala Kendra, 1, Copernicus Marg, New Delhi -110001 B 113, Sarvodaya Enclave New Delhi 110017 Mansarovar Building, Plot No 366 Min, Sultanpur MG Road, New Delhi - 110030 Tel +91 1146538000 | Fax +91 1146538099 www.oxfamindia.org Facebook: @newslaundry Twitter: @newslaundry YouTube: @newslaundry Instagram: @newslaundry Email:contact@newslaundry.com Facebook: @OxfamIndia Twitter: @OxfamIndia Instagram: @Oxfam_India Facebook: @teamworkarts Twitter: @teamworkarts Email: info@teamworkarts.com