Download
1 / 36
360 likes | 555 Views
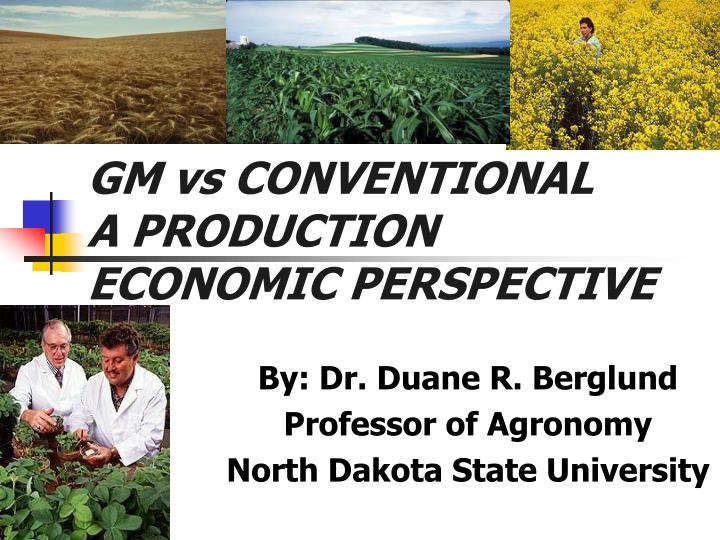
GM vs CONVENTIONAL A PRODUCTION ECONOMIC PERSPECTIVE. By: Dr. Duane R. Berglund Professor of Agronomy North Dakota State University. 2003 GM Planting Intention. USA Soybeans 81 Corn 40 Canola 72 Cotton 73. North Dakota Soybean s 74 Corn 35*

E N D
GM vs CONVENTIONAL A PRODUCTIONECONOMIC PERSPECTIVE By: Dr. Duane R. Berglund Professor of Agronomy North Dakota State University
USA Soybeans 81 Corn 40 Canola 72 Cotton 73 North Dakota Soybeans 74 Corn 35* Canola 72 Cotton 0 *Estimate GM Crops in 2003- % Acres
GM Production Economics • Agronomic costs • Segregation expenses • Competing Commodities • Market impact and risks associated
Agronomics and $$$ • Are Yields Increased? • Costs of Input ( Seed and Chemicals) • Cost or benefits for GM crop in rotation/crop sequence/field separation • Control cost of volunteers • Pest Resistance-Weeds or Insects • Technology fee • No Farmer saved seed allowed
2002 -Soybean Performance - ND * Locations: Arthur, Grandin and Northwood ** Locations: Wyndmere, Mooreton and Great Bend
Farmer Economic Concerns with the Use of GM Crops • Seed costs – Technology fee or not? • Chemical cost vs. alternative chemicals • Application costs (spraying or tillage) • Crop yields equal or not • Weeds controlled • Market acceptance of GMO’s • Bin-Run Seed –not an alternative
Soybean Technology Fee: • 2003 and prior- $8.00 per 50 lbs. (bag) • 2004 – Increased fee- $10 per bag. 50 lb bag of soybeans has approximately 150,000 seeds per bag. • With germination of 90%, Seeding in narrow rows of 175,000 live seed per acre would require 194,500 seeds, or 64.5 lbs. seed. Tech fee cost per acre then would be: $12.96/A.
Corn Technology Fees • RR Corn- $24.00 per bag* • Bt. Corn Borer- $18.00 per bag • Bt. Corn Rootworm - $18.00 per bag • Liberty Link Corn- No Tech fee!! * 80, 000 seeds per bag- Will plant 2.5 to 4 Acres
Canola Technology Fee • RR Ready Canola- $15/A planted plus the farmer receives 1 pint/A free of Roundup RT • Liberty Canola- No Tech Fee!! • Clearfield Canola- Not a GM crop, No Fee!
Segregation/Testing in Practice • Malting Barley- 100% of malting barley is segregated and marketed by variety • Dry Edible Beans by Class/Var.
Soybeans High oleic High sucrose High protein White wheat Malting barley NON-GM0 Soybean, canola and corn. Corn High oil White High amylose Waxy Organic crops Examples of Identity Preserved Grains
Segregation and Identity Preserved Crops have what in Common?? Increased Costs-$$
Increased costs? • Farm: • Cleaning planters, combines and other equipment • Field locations/induce or prevent cross-pollination • Additional bin storage/cleaning/opportunity costs • The Information Trail
Increased costs? • Elevator: • Separate bins/opportunity costs • Dumping in correct pit = added risk of cross contamination • Cleaning pits, conveyors and loading equipment, trucks, and rail. • Terminal elevators- Storage separation, barge loading and separated transport. • Totes are not feasible for high volume commodities
Testing: Technology- • Strip tests (protein): • $7.50/test • Time: <1 Hour • Accuracy: 95% • PCR (DNA) --preferred in international contracts (currently used in RRW corn) • 1-2 days • Tolerance/Confidence/cost (Sept 2001) • 1% tol. @ 99% conf. @ $120/test • .1% tol. @ 95% conf. @ $300/test • .1% tol. @ 99% conf. @ $400/test
“Field of Dreams”Philosophy of Farmers and Others • Build it and they will come • Produce it and they must buy?? • Mill, press and process it and they will eat it! • We are the primary source of product! • Consumers have little choice!
Loss of Markets by GM Crops Risk to add surplus commodity at reduced prices (Examples) • Corn in Europe and Asia • Canola to Europe • Soybeans to Europe and parts of Asia
GM Wheat- Production Economics • Increased Yields • Better Crop safety • Reduced Dockage • Less Herbicide cost • Control Volunteers Seed Cost- Higher as no-saved seed • Technology User Fee • Market and Prices
Wheat Production Comparison(Estimates) Per Acre Input costs-
Other Cost considerations • Conventional Wheat Saved Seed • Purchase of RR Wheat Seed plus TUA fee each year!! • Control of Volunteers in other Crops • Yield advantage? 3 bu/A Sask. Data. • Reduced control costs of weeds in sequential crops • Segregation costs
Roundup Ready Wheat and the Markets • International Buyers are saying “no” to Gm Wheat!! • Millers and bakers in USA are negative. • Market prices may drop significantly! How much?? • Fast food industry may become involved
GM Wheat: If and When Released • Genetically Modified (GM) wheat such as Roundup Ready wheat is an example of “irreversible technology. • It will cause environmental, production and market externalities. • Without the ability to segregate GM and non-GM wheat in the market channels, the market is vulnerable to downward price trends.