Download
1 / 12
130 likes | 279 Views
Lesson 1.2. Functions and Their Graphs. Lance Barber, Benjamin Brayton, and Abel Bastarache. Constant Function. This function occurs when “y” equals a constant, or, more simply put, y=k. Identity Function. This function possesses both a range and a domain, making it y=x. Quadratic Equation.

E N D
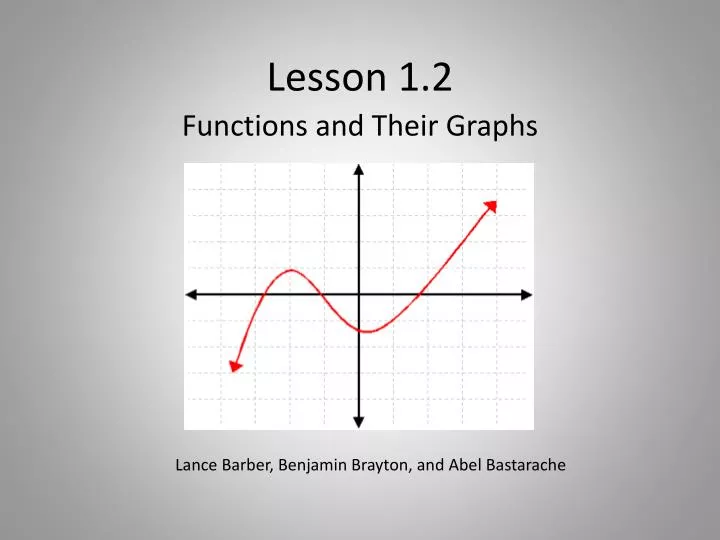
Lesson 1.2 Functions and Their Graphs Lance Barber, Benjamin Brayton, and Abel Bastarache
Constant Function • This function occurs when “y” equals a constant, or, more simply put, y=k.
Identity Function • This function possesses both a range and a domain, making it y=x.
Quadratic Equation • A Quadratic is an equation that forms a parabola when graphed, such as y=x².
Cubic Function • A cubic function usually forms a horizontal line that is wavy in the middle. An example of a cubic function is y=x³
Absolute Value Function • An absolute value function, when graphed, results in a symmetrical graph, such as that of y=|x|.
Square Root Function • A square root function typically forms a curve that straightens over time, such as y=√x
Cubed Root Functions • A cubed root tends to form a wavy curve from left to right, such as y=³√x.
Vertical Line Test • To determine if a line represents a function, draw a vertical line. If the line only intersects with one point no matter where it’s drawn, the line is a function.
Increasing/ Decreasing Function • If the line has a positive slope, it is an increasing function. If the slope is negative, it is decreasing.
Relative Minimum/Maximum • The point at which a function begins increasing or decreasing is the relative minimum or maximum. It is the minimum if the function goes upward away from the point, and maximum if it goes downward.
Even and Odd Functions • If x and –x have the same y, it is an even function. If the function is rotated 180 degrees across the origin and has rotational symmetry, it is odd. Even Odd