Download
1 / 23
230 likes | 430 Views
Variability of the Earth’s OLR inferred from reanalyses and satellite observations. Richard Bantges, Claudio Belotti, Helen Brindley and Jon Murray. Space & Atmospheric Physics. CLARREO Science Team Meeting, July 2010. Outline. Modelled ‘clear-sky’ IR variability from ERA Interim reanalyses

E N D
Variability of the Earth’s OLR inferred from reanalyses and satellite observations Richard Bantges, Claudio Belotti, Helen Brindley and Jon Murray Space & Atmospheric Physics CLARREO Science Team Meeting, July 2010 © Imperial College London
Outline • Modelled ‘clear-sky’ IR variability from ERA Interim reanalyses • Clear-sky IR spectral signatures from satellite interferometer data • All-sky sampling studies using SEVIRI • Future developments and activities © Imperial College London
(1) Modelled ‘clear-sky’ variability from ERA Interim • ERA Interim covers period 1989 onward • Profiles of T, H2O(g), O3 from reanalyses • CO2, CH4, N2O from UKMO records (total column, 5 year global mean, interpolation) • Surface emissivity constant at 0.99 globally • Spectral radiances simulated at nadir using Oxford RFM © Imperial College London
RFM model runs • So far: 1989, 1994, 1999, 2004-2008 • monthly mean fields (‘clear-sky’ but using all profiles) • 37 atmospheric levels (1000-1mb) • spatially resolved 1.5°x1.5° • 100-2500cm-1, spectral resolution 0.5cm-1 • ~29000 RT simulations per month © Imperial College London
ERA Interim – temperature anomalies Step change: 1998: SSU replaced by AMSU-A Temperature anomaly (K) © Imperial College London
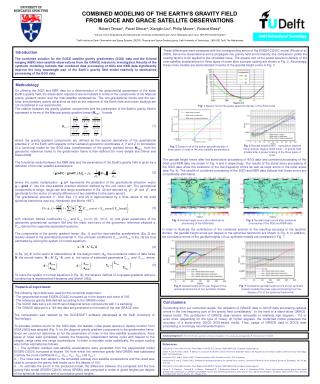
ERA Interim: 3 & 5 yr global average differences O3 Std. dev. (1σ) BT (K) CO2 CH4 CO2 H2O © Imperial College London
ERA Interim – Annual mean atmospheric profiles © Imperial College London
ERA Interim: 3 year global variability 2004-2006 2005-2007 2006-2008 Std. dev. (1σ) BT (K) © Imperial College London
El Niño Southern Oscillation Index 2008 2004 © Imperial College London
ERA Interim: 3 & 5 year zonal averages Std. dev. (1σ) BT (K) Std. dev. (1σ) BT (K) © Imperial College London
(2) Spectral signatures from satellite data © Imperial College London
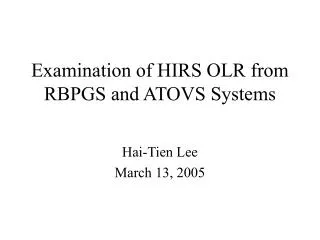
Data / Methodology • IMG – level 1D (band3, calibrated, unapodized) • IASI – level 1C (band1&2, calibrated, apodized) (±2.5° off nadir) • IMG & IASI resampled to 0.02cm-1 dispersion grid • IMG data convolved with the IASI instrument function • Semi-empirical wavenumber shift applied to IMG to match IASI • SST – ERSST v3b (Extended Reconstruction Sea Surface Temperature) • Central Pacific region (±10°N, 130-180°W) • AMJ average, cloudy spectra removed using brightness temperature at 10.8μm contrast with SST. (5K).
(3) All-sky sampling studies using SEVIRI • Investigate impact of sampling strategies using narrow-band spectral channels • What is the effect of increased spectral resolution on previous results? (e.g. Doelling, Kirk-Davidoff) • What is seen at different wavelengths? • What degree of averaging is required to meet desired accuracy (i.e. do we need all wavelengths – e.g. different requirements may have different needs)? © Imperial College London
All-sky sampling: method • Channels: 6.2, 7.3, 8.7, 10.8, 12.0, 13.4 microns. Temporal/Spatial resolution: Data every fifteen minutes, from approx 75N-75S, 75W-75E. • 3 months of data processed so far (from 2010) • Sampling strategy: Fly through 1 true-polar orbiter with SEVIRI pixel size (~10-25 km) footprint sampling every 200 km along ‘pseudo’ satellite track • Results binned to 15 x 15 degree averages and compared to fully sampled fields. © Imperial College London
8.7 13.4 12.0 10.8 7.3 6.2 SEVIRI narrow-band channels A typical clear-sky spectrum of outgoing thermal energy
SEVIRI – 10.8 mm, 1 month average True Sampled NOTE: Questions were raised over the validity of the satellite tracks used. These results are pending further investigation. © Imperial College London Sampled - true
SEVIRI – 10.8 mm, 3 month average True Sampled NOTE: Questions were raised over the validity of the satellite tracks used. These results are pending further investigation. Sampled - true
SEVIRI – 6.2 mm, 3 month average NOTE: Questions were raised over the validity of the satellite tracks used. These results are pending further investigation. © Imperial College London
‘Zonal’ averages (across SEVIRI disk) NOTE: Questions were raised over the validity of the satellite tracks used. These results are pending further investigation. © Imperial College London
Summary (1) • Shown from ERA Interim model studies that 3 yr lifetime may not be sufficient to fully sample the “natural” variability • ENSO record suggest that 5 year would be better at capturing variability • Initial studies using (IASI & IMG) satellite data show consistency with inter annual and longer term ERA interim mean profiles (for well mixed GHGs) • Water vapour and ozone require more detailed anaylses © Imperial College London
Summary (2) • Initial investigations of sampling strategy highlight that different levels of sampling accuracy will be obtained in different wavelength bands • Caution - the maximum IR differences aren’t always observed at 10.8mm © Imperial College London
Future developments • Extend the period of ERA interim to look at a full 10 year cycle • Treatment / assessment of uncertainties introduced by cloud fields within ERA interim modelling • Extend IASI / IMG comparisons to 60N/S • IASI clear / all sky inter-annual variability • Full year (+) sampling strategy with SEVIRI (can adapt sampling) • Extend letter of agreement between NCEO & NASA • Submitted proposal SDT- TIR & FIR studies- Calibration / Validation © Imperial College London