Download
1 / 62
640 likes | 851 Views
Chapter 8 Correlation and regression analysis. Chapter 8 Correlation and Regression Analysis Statistics in Practice

E N D
Chapter 8 Correlation and regression analysis
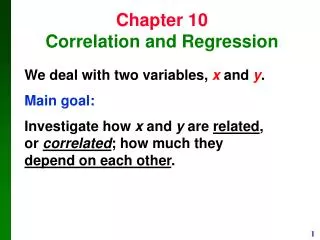
Chapter 8 Correlation and Regression Analysis Statistics in Practice The restaurantvocation in western countries has an unwritten law, that is when consuming service in restaurant, people need to pay a amount of tips, many people heard of that how much of tips should pay? About 16% of bill, is it true? Let’s seeing about table 10-1, the data in table is the sample data through investigation, through analyzing and observing these data, we can find out the quantity relation of two. STAT
STAT Chapter 8 Correlation and Regression Analysis • Quest ions are : • 1 Are there enough evidences to conclude: there exists some relations between bill and tips? • 2 If this relation exists, how to use this relation to confirm how much of the tips should be left? • The key points in this chapter are making some deduction based on the sample data appeared in couples . Example as above, we want to make sure if there exists some relations between bill and tips, if it exists, we want to use a formula to describe it, by doing so we can find out the rules people obeyed when they pay tips. There are many questions like this, such as: • The rate of crime and the rate of stealing; • The cigarettes being consumed and the rate of being cancered; • The level of individual’s earning and the years of being educated; • The age and blood pressure; • The stature of parents and children; • The stipend and the price of alcohol; • The length of lifeline in the palm of people and the length of people’s life-span.
STAT Chapter 8 Correlation and Regression Analysis Key points 1 Correlative relations and the description of regression equation; 2 Correlative relations of determination; 3 Fit the regression equation; 4 The application of regression equation. Difficult points 1 Calculate coefficient of production-moment correlation 2 The sum of squares of total deviation and its decompose References and Bibliography 1、Li Xinyu:《Application Economy Statistics》,Beijing university Press; 2、David S.Moore:《The World of Statistics》,Zhongxin Press; 3、Yuan Wei:《New Statistics Tutorial》,Economy and Technology Press; 4、Statistics Websites:UNSD、OECD、China National Statistics Bureau ;
STAT Chapter 8 Correlation and Regression Analysis Summarize the correlation relations 1 Mutual relations between variables (1) Function relation Definition: Complete certain( quantity) relation. A: One group of variables have one to one corresponding relations with another group of variables; [Example] Wages by pieces (y) and output (x) y=f(x)=10x; x0=1piece, y0=10yuan; x1=2piece, y1=20yuan the area of round S=ΠR2,R=10,S=100 Π B: y the variable being explained( dependent variable); x explained variable( independent variable). 2 Correlation relation (1) Definition: Incomplete certain relation. A: When one group of variables have relations with the other one, but not one to one corresponding;
Chapter 8 Correlation and Regression Analysis • [ Example ] Stature y and Weight x; • A:x=60kg、y=170m; B: x=60kg、y=1.72m; • C:x=60kg、y=1.68m; D: x=60kg、y=1.65m。 • B: Description:y=f(x)+。 • The factors that affect stature: weight 、 inheritance 、exercise 、the quality of dormancy • 2 、Causes • Some affected factors haven’t been recognized; • Although have been recognized but can’t be measured; • Measure errors. • [ Example ] some fruit p yuan/kilo: quantum of purchase y=Px quantity • x=2kilo y=2P+=2×1.9+0.2 • 3 、The forms of quantity relations
STAT Chapter 8 Correlation and Regression Analysis (1) Single cause and effect relations; (2) Mutual cause and effect relations; (3) Concomitant relations. 3、The kinds of correlativity (1)Sort by correlative level A: Complete correction:function relations; B: Dissociation :no relations; C: Incomplete correction. (2)Sort by corrective direction A: Positive correlation: the variables’ directions of change are the same( increase the same time and decrease the same time); B: Negative correlation: the variables’ directions of change are opposite( one increases and the other decreases).
STAT Chapter 8 Correlation and Regression Analysis Correlative level is close 3 Sort by correlative forms (1) Linear dependent; (2) Linear independent Correlative level is not close
STAT Chapter 8 Correlation and Regression Analysis 4 Sort by affected factors (1) Single correlation: only one variable: [Example] The grades of study and the time spent on it; Blood pressure and the age; the output of a unit of area and the quantity of fertilizing. (2) Multiple correlation: two or more than two variables; [Example] The relations between the growth of economy and the growth of population 、 the level of science and technology 、natural resource 、the level of management and so on. The relations of weight 、appetite 、the time of sleeping and so on. (3) Partial correlation: Measure the two variables’ correlative level among some variables while supposing other variable doesn’t change. [Example] To y=ax1+bx2+ ,investigate the relations of y and x1, supposing x2 doesn’t change.
STAT Chapter 8 Correlation and Regression Analysis Measure the relations of linear dependent [Purpose ] Measure the correlative directions and close level among the variables. 1 Correlative graph (1)Correlative table A: Single variable grouping of correlative graph: independent variables are grouped and calculated the times, dependent variables are only calculated the average numbers. Relational data of 30 congener enterprises The numbers of enterprises Output (piece) x Average cost of a unit (yuan) y 20 30 40 50 80 9 5 5 6 5 16.8 15.6 15.0 14.8 14.2
STAT Chapter 8 Correlation and Regression Analysis (2) Double variables grouping of correlative graph: both dependent variable and independent variable are grouped. Annotate: independent variable X axis; dependent Y axis. Relational data of 30 congener enterprises Output x (piece) Cost of a unit (yuan/piece) Summation 20 30 40 50 80 __ 3 2 __ __ 1 3 1 __ 1 3 2 __ __ 1 4 18 16 15 14 4 9 10 7 4 4 1 __ Summation 9 5 5 6 5 30 2 Correlative table: scatter diagram [Shortage] Difficult to reflect the correlative close level accurately
STAT Chapter 8 Correlation and Regression Analysis 2 (Linear) Correlation coefficient (1) Production-moment method calculation formula Suppose is a group of sample observation values of then, is the correlation coefficient of x and y , Covariance Standard deviation
STAT Chapter 8 Correlation and Regression Analysis 2 The effects of covariance xy (1) Show the relative direction of x and y. Positive correlation
STAT Chapter 8 Correlation and Regression Analysis [Negative correlation] Negative correlation
STAT Chapter 8 Correlation and Regression Analysis Table A dense distributing Table B dishevelled distributing 2、Show the relative level of x and y partial to bigger partial to smaller
STAT Chapter 8 Correlation and Regression Analysis Table A dense distributing Table B dishevelled distributing [ Negative correlation ] partial to bigger partial to smaller
STAT Chapter 8 Correlation and Regression Analysis Table B Table A [Dissociation ] X and y have no linear correlation
STAT Chapter 8 Correlation and Regression Analysis [ Conclude ] The effects of xy Firstly, show the relative direction of x and y No linear correlation Positive correlation Negative correlation Secondly, show the relative close level of x and y Is bigger the relative level of x and y is higher Is smaller the relative level of x and y is lower
STAT Chapter 8 Correlation and Regression Analysis 3 The effects of x、y Make covariance of different variables standardization direct contrast. Standardization covariance
STAT Chapter 8 Correlation and Regression Analysis 2 Let The same can be proved
STAT Chapter 8 Correlation and Regression Analysis 4 Shortcut calculation formula of correlation coefficient by production-moment method Conclusion:
STAT Chapter 8 Correlation and Regression Analysis [Shortcut calculation formula] Conclusion
STAT Chapter 8 Correlation and Regression Analysis [r’s terse calculation formula]
Chapter 8 Correlation and Regression Analysis STAT 5 The judge rules of linear dependent Slender correlation Low correlation Significance correlation High correlation X and y have non-linear relation, but may have other relations X and y have absolute linear relation: function relation [Example] In order to know the amount relations of consumption and tips in restaurant , select 10 consumers through random sampling from some consumers to investigate, the amounts gained are in the following: The data of the consumption amount in restaurant and the tips are in the following: unit: dollar Consumption 33.5 50.7 87.9 98.8 63.6 107.3 120.7 78.5 102.3 140.6 Tips 5.5 5.0 8.1 17 12 16 18.6 9.4 15.4 22.4
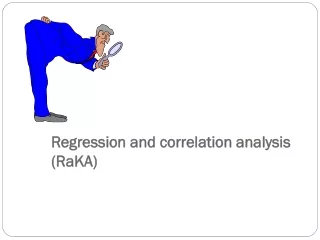
STAT Chapter 8 Correlation and Regression analysis chirognomy Someone believe that the length of the lifeline of palm can forcast their’s life span. In the letter which relesed in 《 American medicine association transaction 》byM.E.Winson andL.E.Mather, denounce refute it through the research of the ashes. The age of death and the length of the lifeline of palm are recorded. The author have a conclusion that there have no pertinent relevent between the age of death and the length of the lifeline of palm . Hand anthroposcopy is lost, so the hand put down.
Chapter 8 Correlation and Regression analysis STAT (6) Characteristic of relevent coefficient of sample 1, two variables both are random variable. 2, two variables are equal rxy= ryx。 3, the extent of closing to 1 is relevent to sample content n. n small r 1. sepecial example : when n=2, r=1 [Example] : sample (x,y)is (6,12.6),(1,3.0), n=2. [Example] draw out 10 stores randomly from the 100 stores, we have stores money 8 Profit %
Chapter 8 Correlation and Regression analysis STAT (7) normal error of correlation When we explain the result of correlation, there would be there normal errors. 1, correlation imply the relation of cause and effect. Such as : one research indicate that the salary of the statistic professor have a positive correlation with the amount of consuming of beer of per person, but these two variables are effected by economic position. 2, Correlation coefficient is zero, to a centainty is inrelevent. 3, the correlation extent of the relevent analysis of mean value and the relevent analysis of unit data. For example: in a research, the twin data of individual income and education bring the linear correlation cofficient 0.4, but when the area of using is average, the linear correlation cofficient change to 0.7.
Chapter 8 Correlation and Regression analysis STAT (8) Hypothesis testing of linear correlation ( two methods) 1, advance the original and alternative hypothesis 2, advance the the level of significance α. 3, choose the method of testing and design tesstatistic. 4, compared test statistic with critical value, if the absolute value of test statistic is larger than the critical value, reject the original hypothesis, otherwise, don’t reject original hypothesis. T testing r testing: using the computed r as the test statistic, its critical value can be find in the table
Chapter 8 Correlation and Regression analysis STAT Hypothesis testing of linear correlation ( two methods) Like the former example: r of the bill and tip is 0.92, if use test statistic; If so reject original hypothesis it is considered that there exists pertinent relevant relationship between bill consumption and tip r testing hypothesis: N=10,r=0.92,rα=0.632,∵ r> rα∴reject original hypothesis, consider there exsit pertinent linear correlation between the two.
Chapter 8 Correlation and Regression analysis STAT The third section regression analysis A. summarize of regression analysis (1) concept 1, linear correlation analysis: calculate the linear correlation coefficient r establish the correlation aspect and osculation extent of the two variables. [not enough] can not indicate the relation of cause and effect of the two variables can’t presume the change of the variable( y) according to one or several variables (xi) The money and tip of ten consumers who have meals consume Bill x 33.5 50.7 63.6 78.5 87.9 98.8 107.3 102.3 120.7 140.6 Tip y 5.5 5 12 9.4 8.1 17 16 15.4 18.6 22.5 r=0.92
Chapter 8 Correlation and Regression analysis STAT 2, regression analysis : through the change of one variable to explain the change of other variable y = a+bx 、 y=a+b1x1+bx2、 y=0+ 1x1+ 2x2+…+ nxn [regression] first advance by England biologist F · Galton elder stature offspring stature X y y = f(x)+ men’s average stature (2) varieties of regression analysis 1, classify by the number of independent variable (1) simply ( unitary ) regression: only one independent varible [example] y = a+bx unitary regression equation (2) ] multiple regression: two or more independent varibles [example] y=0+ 1x1+ 2x2+…+ nxn
Chapter 8 Correlation and Regression analysis STAT 2, classify by the character of the regression equation (1) linear regression: dependent variable is the linear function of independent variable [example] y = a+bx unitary linear regression equation (2) nonlinear regression: dependent varible is the nonlinear function of indenpent variable [example] double curve regression equation power function regression equation Exponential function regression equation Logarithmic function regression equation
Chapter 8 Correlation and Regression analysis STAT (3) steps of regression analysis 1, establish independent and dependent variable [example] output of food supplies (y) output of fertilization (x); expenditure of consume ( y ) country income (x) ; fire lost ( y ) the distance between the fire accures and the nearest firehouse ( x ) . 2, establish the sample regression equation 3, testing statistic 4, forecast or control [example] the regression equation of consume and income: y= a+bx= 200+0.15x known x establish y : estimate or forcast known y establish x : control
Chapter 8 Correlation and Regression analysis STAT B, fit of unitary linear regression equation (1) population regression equation [example] the data of governable income and the expenditure of consume of 40 families income consumption first group second group third group fourth group firth group condition probility condition mean condition probility : condition mean :
Chapter 8 Correlation and Regression analysis STAT [table] distribution distribution distribution Population regression beeling
Chapter 8 Correlation and Regression analysis STAT [suppose] the mean of y distribution are all in a beeling Premise 1 : there exist linear relation between X and E (Y/X ) Premise 2 : N Premise 3 : the effect of casual factor is counteracted. = population regression beeling Population regression beeling
Chapter 8 Correlation and Regression analysis STAT Yi/Xi= condition mean +εi=α+βXi+ εi random disturb and suppose Population regression beeling Population regression beeling
Chapter 8 Correlation and Regression analysis STAT [ fit ideas ] sample Nn, Sample regression equation = population regression beeling Population regression beeling
Chapter 8 Correlation and Regression analysis STAT ( 2 ) fit of sample regression equation randomly sample from the population, get a group of sample observational value. [example] : the data of the governable income and expenditure of consumption of 40 familities income consumption condition probility condition mean
Chapter 8 Correlation and Regression analysis STAT sample regression equation ( beeling ) [table] Residual : observational value – regression value sample a population regression coefficient sample b population “ population regression equation “ is unknown Sample regression beeling
Chapter 8 Correlation and Regression analysis STAT step : 1, use sample date fit sample regression beeling, try to reduce error; 2, test the fungible extant of sample regression beeling for population regression beeling. known unknown Sample regression beeling
Chapter 8 Correlation and Regression analysis STAT ( 3 ) the fit method of sample regression equation 1, fit method of absolute value Let the beeling of “ best beeling “ 2, OLS basic thinking : the beeling which make squares sum of residual least is “ best beeling “ find the best beeling find the best a and b
Chapter 8 Correlation and Regression analysis STAT can find the value of a and b which make the value of Q is least We get From ( 1 ) equation
Chapter 8 Correlation and Regression analysis STAT Let a into the (2) equation, we get clean up :
Chapter 8 Correlation and Regression analysis STAT [simple calculate] Known :
Chapter 8 Correlation and Regression analysis STAT The relationship of correlation coefficient r and regression coefficient b (1) both are in the same direction; (2) r reflect the correlation direction and osculation extent b reflect the average change of one variable when a variable change a unit .
Chapter 8 Correlation and Regression analysis STAT Example: In order to research the relationship between the consumption of having dinner and expenditure of tip, randomly draw out ten customers of having dinner, we get sample date follows: The money of having dinner consumption and tip data follows: unit: dollar consumption tip please fit sample regression equation sample correlation coefficient r=0.92
Chapter 8 Correlation and Regression analysis STAT [example] In order to research the relationship between the consumption of having dinner and expenditure of tip, randomly draw out ten customers of having dinner ( use EXCEL softeware inborm the scatter diagram ) please fit sample regression equation
Chapter 8 Correlation and Regression analysis STAT • Solution: through the scatter diagram can approximatively see the linear connection between the consuming of having dinner and tip expenditure. So we let • y=a+bx • regression equation: • Economic meaning: when add the 100 RMB of the consuming of having dinner expenditure, there are averaged adding 16.6RMB of the tip expenditure.
Chapter 8 Correlation and Regression analysis STAT • The variance analysis of regression equation • Bring forward the question: sample magnitude, namely fit goodness. • (1)decompose of the sum of squares for total deviation • total deviation= • residual + regression deviation • regression deviation