Download
1 / 36
380 likes | 493 Views
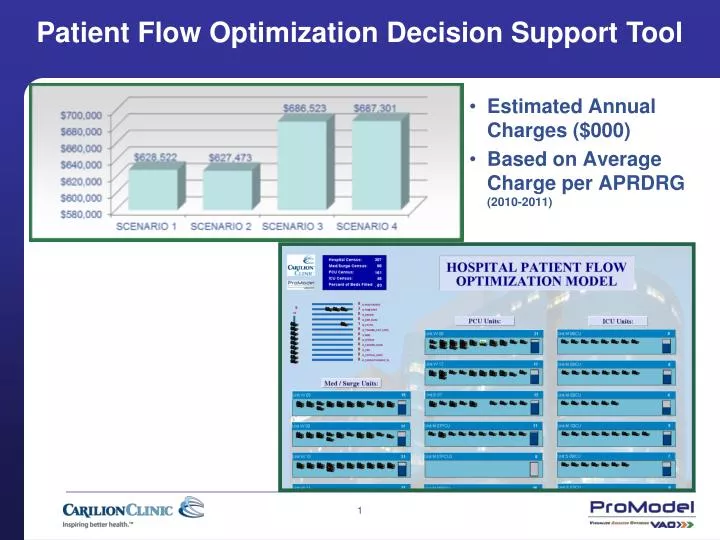
Patient Flow Optimization Decision Support Tool. Estimated Annual Charges ($000) Based on Average Charge per APRDRG (2010-2011). Agenda. Introduction The Case for Simulation in Healthcare-Alex Kolker Leveraging Predictive Analytics through Simulation in Healthcare

E N D
Patient Flow Optimization Decision Support Tool • Estimated Annual Charges ($000) • Based on Average Charge per APRDRG (2010-2011)
Agenda • Introduction • The Case for Simulation in Healthcare-Alex Kolker • Leveraging Predictive Analytics through Simulation in Healthcare • What Is Simulation Modeling and Why It Impacts Healthcare Delivery? • Carilion Clinic Case Study-Jim Montgomery • Patient Flow Optimization • Lessons Learned • Ongoing/Future Use of the Simulation Solution • Thank You/Q&A
Simulation Is… • Applied to a wide range of problems in healthcare management and operations • Used to study complex processes using a computer model that represents system behavior • A methodology of choice for situations that are too complicated to represent using analytic formulas (e.g., queuing analytic theory)
Simulation Answers Questions Such As… • How many nurses do you need at a time on any inpatient unit? • Should you add another CT scanner to your radiology service? • How many beds do you need to staff your ED at different times of the day or days of the week? • What additional resources (nurses, beds, etc.), if any, do you need to decrease your rate of LWBS in the ED?
Simulation Answers Questions Such As… • How many phlebotomists do you need to guarantee acceptable waiting times? • What is the highest occupancy/utilization rate you can tolerate? • How many beds or staff should you budget for? There is no accurate way to answer the types of questions above without simulation modeling. Everything else is just a guess!
What is Simulation and How Does a DES Model Work? • A discrete event simulation (DES) model of a system/process is a computer modelthat mimics the dynamic behaviorof the system/process as it evolves over time in order to visualize and quantitatively analyze its performance. • The validated and verified model is then used to study the responseof the system/process to input variablesin order to identify improvements based on some improvement criteria.
What is Simulation and How Does a DES Model Work? • DES models track patients (documents, work-pieces) moving through the distinct steps of the system (events) at distinct points of time. • They are called Discrete Events. • The detailed track is recorded for all processing times and waiting times. Then the system’s statistics for entities and activities are gathered.
How Can It Help Us? How can we simulate the patient arrivals and service system response? System Arrivals Queue (Waiting Line) Service Exit
Example Suppose we measure the actual time between patient arrivals and the service time
Example continued Let’s start at the time, t=0, with no patients in the system. We will be tracking any change (event) that happened in the system.
Example System Output Statistics In the end the statistics gathered are: • the average patient and server waiting time • its standard deviation • the number of patients in the queue • the confidence intervals • any other custom process statistics/information
System Capabilities • DES models are capable of tracking thousands of individual entities arriving randomly or in a complex pattern. • Each entity has its own unique attributes, enabling one to simulate the most complex systems with interacting events and component interdependencies.
Flaw of Averages Capacity and staffing decision/planning based only on averages, without taking into account particular arrival and service time distributions, usually result in significant miscalculations.
Typical DES Applications Include: • Staff and production scheduling • Capacity planning • Cycle time and cost reduction • Throughput capability • Resources and activities utilization • Bottleneck finding and analysis • DES is the most powerful tool with which to perform quantitative “what-if” analysis and test different scenarios of process behavior as system parameters change over time. • Simulation allows one to experiment on the computer, and to test different options before going to the hospital floor for actual implementation.
The Power of Simulation • Used for problems difficult to solve analytically • Can experiment with system behavior without experimenting with the actual system • Compresses time • Valuable tool for training decision makers
Case Study: Computer Simulation Model Carilion Hospital Patient Flow Optimization Jim Montgomery MHA, FACHE, CSSBBSenior Performance Improvement ConsultantInformatics, Analytics and Improvement DivisionCarilion Clinic Roanoke, Virginia
Carilion Agenda • Value to Carilion • Why Simulate? • Variation • Demo • Scenarios of Interest • Key Output/Sample Results • Lessons Learned • Contact Info/Q&A
Hospital Patient Flow OptimizationValue to Carilion Clinic • Cost An environment in which to experiment without the cost of actually opening or expanding a unit • Time The tool used during a throughput decision-making committee meeting for instant forecasts • Capacity Knowing that the decision to open PCU bed space would reduce the percent of beds occupied by X amount and PCU unit census by Y amount
Making Throughput Decisions in a Complex Hospital System The Challenges - Variation • Volume of arrivals • Timing of arrivals (day of week, time of day) • Service line specialty of admitting physician • Acuity level of patient at time of admission (requires Med/Surg unit, PCU, or ICU) • Bed capacity among nursing units • Transfer Center’s distribution of patients • Patients’ length of stay on each unit • Patients’ movement between nursing units (moves up in acuity, moves down in acuity, or moves to unit of similar acuity)
Key Model Outputs Scenarios of Interest
A More Specific Research Question • If we: 1. Close 10 swing space PCU beds 2. Open a unit with 8 PCU beds 3. Open an additional unit with 9 PCU beds • Set aside a PCU ward for observation patients • What happens to: 1. Census on the units affected 2. Percent of beds filled on the units affected 3. Overall hospital census 4. Percent of Hospital beds filled
Scenarios of Interest(Playing What if) • Scenario 1: OldBase Case: Used to build model, based on 2010-2011 data. Used for validation. • Scenario 2: New Base Case: Increases admissions/unit capacity to present rates • Scenario 3: Open 7M PCU2 and close Swing Units on 7S and 8S • Scenario 4: Expand capacity. Open 7W • Scenario 5: Establish 7E PCU exclusively as an observation unit
Key Model Outputs Key Output and Sample Results
How are PCUs Affected?Average Census and Extra Capacity Key Scenario 2 – The New Status Quo Scenario 3 – Open 7MPCU2, Close 7 & 8 Swing Beds Scenario 4 – Expand Capacity: Open 7W Avg Census Avg Extra Capacity
How are PCUs Affected?Average Census and Extra Capacity Key Scenario 2 – The New Status Quo Scenario 3 – Open 7MPCU2, Close 7 & 8 Swing Beds Scenario 4 – Expand Capacity: Open 7W Avg Census Avg Extra Capacity
How are PCUs Affected?Average Census and Extra Capacity Key Scenario 2 – The New Status Quo Scenario 3 – Open 7MPCU2, Close 7 & 8 Swing Beds Scenario 4 – Expand Capacity: Open 7W Avg Census Avg Extra Capacity
Sample Results • But What Else Changes? • Other PCU Beds – Change in Percent Occupied AVERAGE PERCENT OF BEDS OCCUPIED
Sample Results • Impact on Med/Surg Wards? • Change in Percent Occupied AVERAGE PERCENT OF BEDS OCCUPIED
Sample Results • Estimated Annual Charges ($000) • Based on Average Charge per APRDRG (2010-2011)
Sample Results • How Successful Is Our Attempt to Place Patients? • Physicians’ 1st Choice for Unit Assignment (Percent)
Lessons Learned Shorten the process by partnering with ProModel - otherwise we would still be writing code 2. Build the model for rapid flexibility and the ability to change inputs through scenario building 3. Budget additional time for verification and validation 4. Make sure your data set includes all the patients occupying beds in your research locations (i.e., observation patients) 5. Plan for future ongoing use of the tool
Thank You Any Questions? Jim Montgomery, MHA, FACHE, CSSBB jbmontgomery@carilionclinic.org Alex Kolker, Ph.D. alexanderkolker@yahoo.com To buy Alex’s book, go to http://www.springer.com Search for Healthcare Management Engineering. What Does This Fancy Term Really Mean? Jim Cain, MSN jcain@promodel.com ProModel Director Healthcare Solutions