Download
1 / 88
880 likes | 1.02k Views
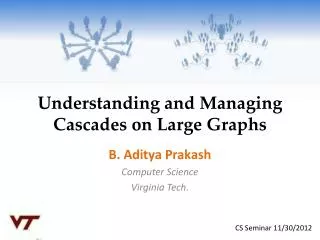
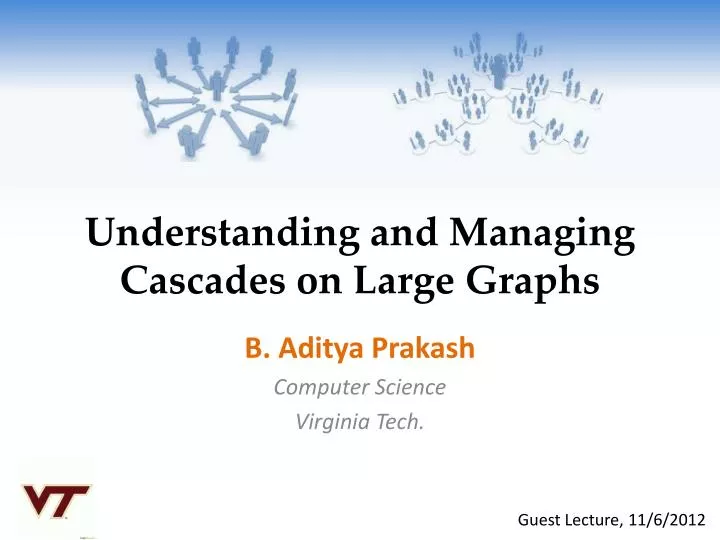
Understanding and Managing Cascades on Large Graphs. B. Aditya Prakash Computer Science Virginia Tech. Guest Lecture, 11/6/2012. Networks are everywhere!. Facebook Network [2010]. Gene Regulatory Network [ Decourty 2008]. Human Disease Network [ Barabasi 2007].

E N D
Understanding and Managing Cascades on Large Graphs B. Aditya Prakash Computer Science Virginia Tech. Guest Lecture, 11/6/2012
Networks are everywhere! Facebook Network [2010] Gene Regulatory Network [Decourty 2008] Human Disease Network [Barabasi 2007] The Internet [2005] Prakash 2012
Dynamical Processes over networks are also everywhere! Prakash 2012
Why do we care? • Social collaboration • Information Diffusion • Viral Marketing • Epidemiology and Public Health • Cyber Security • Human mobility • Games and Virtual Worlds • Ecology • Localized effects: riots…
Why do we care? (1: Epidemiology) • Dynamical Processes over networks [AJPH 2007] CDC data: Visualization of the first 35 tuberculosis (TB) patients and their 1039 contacts Diseases over contact networks Prakash 2012
Why do we care? (1: Epidemiology) • Dynamical Processes over networks • Each circle is a hospital • ~3000 hospitals • More than 30,000 patients transferred [US-MEDICARE NETWORK 2005] Problem: Given k units of disinfectant, whom to immunize? Prakash 2012
Why do we care? (1: Epidemiology) ~6x fewer! [US-MEDICARE NETWORK 2005] CURRENT PRACTICE OUR METHOD Hospital-acquired inf. took 99K+ lives, cost $5B+ (all per year) Prakash 2012
Why do we care? (2: Online Diffusion) > 800m users, ~$1B revenue [WSJ 2010] ~100m active users > 50m users Prakash 2012
Why do we care? (2: Online Diffusion) • Dynamical Processes over networks Buy Versace™! Followers Celebrity Social Media Marketing Prakash 2012
3: Water Distribution Network • Given a real city water distribution network • Data on how contaminants spread on network • Problem of interest to many (EPA, etc) S Where should we place the sensors to detect all possible contaminations? Prakash 2012
Why do we care? (4: To change the world?) • Dynamical Processes over networks Social networks and Collaborative Action Prakash 2012
High Impact – Multiple Settings epidemic out-breaks Q. How to squash rumors faster? Q. How do opinions spread? Q. How to market better? products/viruses transmit s/w patches Prakash 2012
Research Theme ANALYSIS Understanding POLICY/ ACTION Managing DATA Large real-world networks & processes Prakash 2012
Research Theme – Public Health ANALYSIS Will an epidemic happen? POLICY/ ACTION How to control out-breaks? DATA Modeling # patient transfers Prakash 2012
Research Theme – Social Media ANALYSIS # cascades in future? POLICY/ ACTION How to market better? DATA Modeling Tweets spreading Prakash 2012
In this lecture Given propagation models: Q1: How do viruses compete? ANALYSIS Understanding Prakash 2012
In this lecture Q2: How to immunize and control out-breaks better? Q3: How to detect outbreaks? POLICY/ ACTION Managing Prakash 2012
In this lecture Q4: How do cascades look like? Q5: How does activity evolve over time? DATA Large real-world networks & processes Prakash 2012
Outline • Motivation • Part 1: Understanding Epidemics (Theory) • Part 2: Policy and Action (Algorithms) • Part 3: Learning Models (Empirical Studies) • Conclusion Prakash 2012
Part 1: Theory • Q1: What happens when viruses compete? • Mutually-exclusive viruses Prakash 2012
Competing Contagions iPhone v Android Blu-ray v HD-DVD v Attack Retreat Biological common flu/avian flu, pneumococcal inf etc Prakash 2012
Details A simple model • Modified flu-like • Mutual Immunity (“pick one of the two”) • Susceptible-Infected1-Infected2-Susceptible Virus 2 Virus 1 Prakash 2012
Question: What happens in the end? green: virus 1 red: virus 2 Number of Infections • Footprint @ Steady State • Footprint @ Steady State = ? ASSUME: Virus 1 is stronger than Virus 2 Prakash 2012
Question: What happens in the end? • Footprint @ Steady State • Footprint @ Steady State green: virus 1 red: virus 2 Number of Infections Strength Strength ?? = 2 Strength Strength ASSUME: Virus 1 is stronger than Virus 2 Prakash 2012
Answer: Winner-Takes-All green: virus 1 red: virus 2 Number of Infections ASSUME: Virus 1 is stronger than Virus 2 Prakash 2012
Our Result: Winner-Takes-All Given our model, and any graph, the weaker virus always dies-out completely Details The stronger survives only if it is above threshold Virus 1 is stronger than Virus 2, if: strength(Virus 1) > strength(Virus 2) Strength(Virus) = λβ / δ same as before! In Prakash+ WWW 2012 Prakash 2012
Real Examples [Google Search Trends data] Reddit v Digg Blu-Ray v HD-DVD Prakash 2012
Outline • Motivation • Part 1: Understanding Epidemics (Theory) • Part 2: Policy and Action (Algorithms) • Part 3: Learning Models (Empirical Studies) • Conclusion Prakash 2012
Part 2: Algorithms • Q2: Whom to immunize? • Q3: How to detect outbreaks? Prakash 2012
Full Static Immunization Given: a graph A, virus prop. model and budget k; Find: k ‘best’ nodes for immunization (removal). ? ? k = 2 ? ? Prakash 2012
Part 2: Algorithms • Q3: Whom to immunize? • Full Immunization (Static Graphs) • Fractional Immunization • Q4: How to detect outbreaks? • Q5: Who are the culprits? Prakash 2012
Challenges Given a graph A, budget k, Q1(Metric) How to measure the ‘shield-value’ for a set of nodes (S)? Q2(Algorithm) How to find a set of k nodes with highest ‘shield-value’? Prakash 2012
Proposed vulnerability measure λ λ is the epidemic threshold “Safe” “Vulnerable” “Deadly” Increasing λ Increasing vulnerability Prakash 2012
A1: “Eigen-Drop”: an ideal shield value Eigen-Drop(S) Δ λ = λ - λs 9 Δ 9 9 11 10 10 2 1 1 4 4 8 8 6 2 7 3 7 3 5 5 6 Without {2, 6} Original Graph Prakash 2012
(Q2) - Direct Algorithm too expensive! • Immunize k nodes which maximize Δλ S = argmaxΔλ • Combinatorial! • Complexity: • Example: • 1,000 nodes, with 10,000 edges • It takes 0.01 seconds to compute λ • It takes2,615 yearsto find 5-best nodes! Prakash 2012
A2: Our Solution In Tong+ ICDM 2010 • Part 1: Shield Value • Carefully approximate Eigen-drop (Δλ) • Matrix perturbation theory • Part 2: Algorithm • Greedily pick best node at each step • Near-optimal due to submodularity • NetShield(linear complexity) • O(nk2+m) n = # nodes; m = # edges Prakash 2012
Details Our Solution: Part 1 u(i) A u u = λ . • Approximate Eigen-drop (Δλ) • Δλ ≈SV(S) = • Result using Matrix perturbation theory • u(i) == ‘eigenscore’ ~~ pagerank(i) Prakash 2012
Details P1: node importance P2: set diversity Original Graph Prakash 2012 Select by P1 Select by P1+P2
Our Solution: Part 2: NetShield Corollary: Greedy algorithm works 1. NetShield is near-optimal (w.r.t. max SV(S)) 2. NetShield is O(nk2+m) We prove that: SV(S) is sub-modular (& monotone non-decreasing) NetShield: Greedily add best node at each step Prakash 2012 Footnote: near-optimal means SV(S NetShield) >= (1-1/e) SV(S Opt)
Experiment: Immunization quality Log(fraction of infected nodes) PageRank Betweeness (shortest path) Degree Lower is better Acquaintance Eigs (=HITS) NetShield Time Prakash 2012
Fractional Immunization of Networks B. Aditya Prakash, LadaAdamic, Theodore Iwashyna (M.D.), Hanghang Tong, Christos Faloutsos Under Submission Prakash 2012
Previously: Full Static Immunization Given: a graph A, virus prop. model and budget k; Find: k ‘best’ nodes for immunization (removal). k = 2 ? ? Prakash 2012
Fractional Asymmetric Immunization # antidotes = 3 Fractional Effect [ f(x) = ] Asymmetric Effect Prakash 2012
Now: Fractional Asymmetric Immunization # antidotes = 3 Fractional Effect [ f(x) = ] Asymmetric Effect Prakash 2012
Fractional Asymmetric Immunization # antidotes = 3 Fractional Effect [ f(x) = ] Asymmetric Effect Prakash 2012
Fractional Asymmetric Immunization Drug-resistant Bacteria (like XDR-TB) Another Hospital Hospital Prakash 2012
Fractional Asymmetric Immunization = f Drug-resistant Bacteria (like XDR-TB) Another Hospital Hospital Prakash 2012
Fractional Asymmetric Immunization Problem: Given k units of disinfectant, how to distribute them to maximize hospitals saved? Another Hospital Hospital Prakash 2012
Our Algorithm “SMART-ALLOC” ~6x fewer! [US-MEDICARE NETWORK 2005] • Each circle is a hospital, ~3000 hospitals • More than 30,000 patients transferred CURRENT PRACTICE SMART-ALLOC Prakash 2012
Running Time Wall-Clock Time > 1 week ≈ > 30,000x speed-up! Lower is better 14 secs Simulations SMART-ALLOC Prakash 2012