Download
1 / 48
490 likes | 656 Views
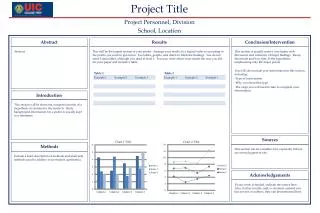
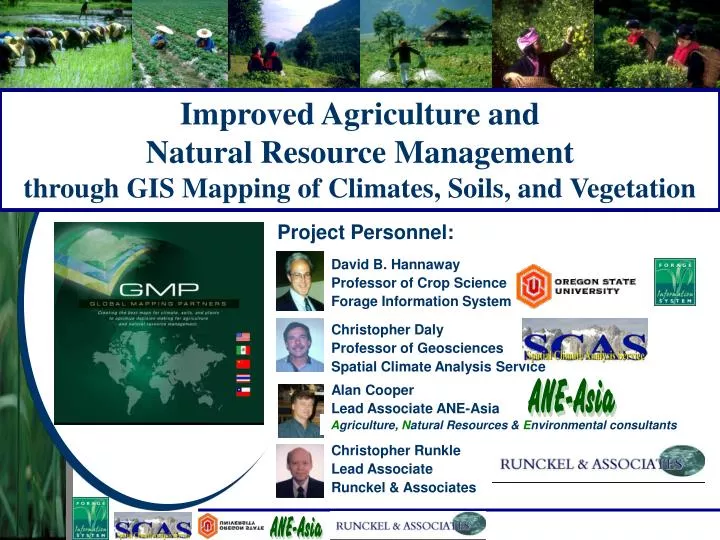
Improved Agriculture and Natural Resource Management through GIS Mapping of Climates, Soils, and Vegetation. Project Personnel:. David B. Hannaway Professor of Crop Science Forage Information System. Christopher Daly Professor of Geosciences Spatial Climate Analysis Service.

E N D
Improved Agriculture and Natural Resource Management through GIS Mapping of Climates, Soils, and Vegetation Project Personnel: David B. Hannaway Professor of Crop Science Forage Information System Christopher Daly Professor of Geosciences Spatial Climate Analysis Service Alan Cooper Lead Associate ANE-Asia Agriculture, Natural Resources & Environmental consultants Christopher Runkle Lead Associate Runckel & Associates
To produce a decision support system (DSS) for improving agriculture and natural resource management through: optimal matching of location, use, and crop/natural resource characteristics Using GIS spatial data layers for climates and soils and a vegetation database Integrating into a web-based DSS Project Objective: Improved Agriculture and Natural Resource Management
Optimal decision making requires integration of: Climate, geo-physical, biological, socio-economic, and geo-political information GIS spatial data layers for better understanding of their inter-relationships Current Challenge: Sub-optimal decision making due to complexity and lack of integration
State-of-the-science tools can be applied to: Create GIS spatial data layers for climates and soils Develop a quantitative tolerances vegetation database Integrate all information into a web-based DSS Current Opportunity: Development and application of current and emerging technology tools
Base information layers of climates and soils are constrained by vegetation tolerances to produce suitability maps, based on: Precipitation, min., max. temperature Soil drainage, pH, salinity, alkalinity Quantitative tolerances for plants Socio-economic conditions Other limiting factors The Concept: Develop “state-of-the-science” spatial data layers, constrain by tolerances, and map
OSU has developed similar products for the USA, PRC, and Europe through: Cooperation with governments, universities, agencies, and organizations Assembling necessary data Creating GIS layers Applying spatial data layers within DSS The Process: Identify cooperators, obtain data,apply proven model used in USA, PRC, EU
PRISM is a Knowledge- Based System developed over 11 years USA mapping for NRCS using 8600 climate stations PRISM software uses point data, DEM, and expert knowledge to create gridded estimates of climate elements Now being applied to EU, China, and Taiwan Current Techniques: for Climate Spatial Data Layers Parameter-elevation Regressions on Independent Slopes Model
Climates USA, PRC, EU, Taiwan 40 year mean annual and mean monthly precipitation Mean monthly minimum temperature Mean monthly maximum temperature Current Products: Internationally recognized “best maps” for climate
Based on soil survey information USA national and county digital soil surveys (STATSGO and SSURGO) are 1:250,000 and 1:24,000 scale PRC surveys and mapping are 1:4,000,000 and 1:1,000,000 scale More detailed maps are being developed for PRC Current Techniques: for Soil Spatial Data Layers http://www.ftw.nrcs.usda.gov/order.html CAAS Soil & Fertilizer Institute
Soils USA, PRC Type Texture Drainage pH Salinity Alkalinity Current Products: Variable scale soil maps STATSGO and SSURGO Soil Information
Traditional approach has been qualitative Need quantitative approach to work with spatial data layers and integrate with crop simulation models Initial estimates have been developed Internet Map Server for web-based improvements via “dynamic mapping” Current Techniques: for Vegetation Tolerances
Internet Map Server: http://blitzen.oce.orst.edu/arcims/adapt/ Public access • View PRISM and suitability maps Private access • Password required • Allows dynamic modeling of species suitability
Internet Map Server: http://blitzen.oce.orst.edu/arcims/adapt/ Map services • PRC and USA Toolbar • Zoom, pan, identify, select, etc.
Internet Map Server: Toolbar Toggle Legend Overview Map Zoom Functions Zoom Functions Panning Identify Find Measure Distance Select Features Clear Selection Print Run Adaptation Model Open Map Service
Layers: Cities, geopolitical, rivers, roads, etc. PRISM: Mean Precipitation, Min. & Max. Temp. by Month Adaptation: Tall Fescue, Orchardgrass, Perennial ryegrass Internet Map Server: http://blitzen.oce.orst.edu/arcims/adapt/ Map Features PRISM layers Adaptation Maps
1. Use Find tool to search for a value. 2. Clicking on the table of search results… 3. Will zoom the map to your selection.
More layers become visible as you zoom into the map Legend displays for the grid data layers.
Run the Adaptation Model: MaxTR = Range of July Maximum Temperature MinT = Minimum January Minimum Temperature PPT = Minimum Mean Annual Precipitation
The map updates to show regions of favorable and unfavorable growth based on inputs to the model. Recall previously run model results by selecting grass type and “Refresh Map” Color legend and table of values used in the model appear with map.
DSS will provide manager with capability to: View the various plant species as tools Know the characteristics of the various “tools” to use them effectively for specific jobs: forage-livestock systems soil conservation preserving species diversity beautification etc. Viewing Plant Species as Tools
Optimal selection is based on species suitability Manager’s job is to match climate, soil, use, and management level to vegetation characteristics New tools, coupled with field testing, make this possible Species Suitability
Climate Precipitation Annual & Seasonal Temperature Minimum & Maximum Soil pH, Drainage, Salinity Pest tolerance Diseases Insects Nematodes Vertebrates Suitability Factors
Drought, heat, cold pH, drainage, salinity Insects, diseases, & nematodes Fertilization, defoliation severity and intensity Forage Species Tolerances
Selected USA states, and provinces in Canada and China have been mapped for climate, soils, and forage species suitability Additional data is needed for higher resolution maps Current PRC Map Products: Provincial level
Validate with field-based evaluation trials Link advanced technologies with traditional approaches Enlist local experts to assist with concept development, implementation and validation Conduct Validation to Ensure Accuracy
Individual pieces are important, nevertheless: For truly helpful product, these pieces need to integrated into an easy-to-use Decision Support System Web-based DSS provides easy access in an efficient delivery tool for farmers and policy makers leading to sustainable systems Integrate into a Web-based DSS
Optimal matching of species and varieties to environment and management as a key to long-term success Combining new computer-based tools with traditional field-based techniques Summary Improved Agriculture and Natural Resource Management can be achieved by: Additional details can be found on web segment http://forages.orst.edu/projects/gmp/