Download
1 / 3
30 likes | 173 Views
1. ICON7 : schéma de l’étude. Étude de phase III, académique, supportée par l’industrie pour évaluer l’intérêt du bévacizumab. Haut risque FIGO stade I-IIA ou stade IIB-IV FIGO Réduction chirurgicale Cancers ovari du péritoine primitif histologiquement confirmés (n = 1 528)*.

E N D
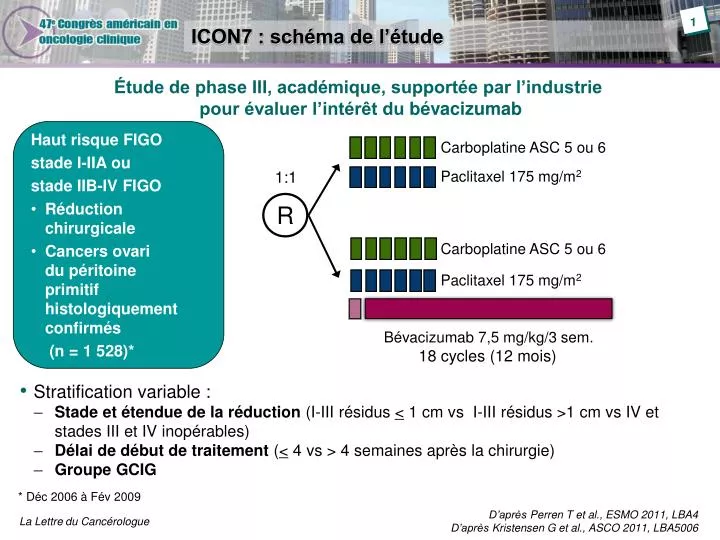
1 ICON7 : schéma de l’étude Étude de phase III, académique, supportée par l’industrie pour évaluer l’intérêt du bévacizumab • Haut risque FIGO • stade I-IIA ou • stade IIB-IV FIGO • Réductionchirurgicale • Cancers ovaridu péritoineprimitifhistologiquementconfirmés (n = 1 528)* Carboplatine ASC 5 ou 6 Paclitaxel 175 mg/m2 1:1 R Carboplatine ASC 5 ou 6 Paclitaxel 175 mg/m2 Bévacizumab 7,5 mg/kg/3 sem. 18 cycles (12 mois) • Stratification variable : • Stade et étendue de la réduction (I-III résidus < 1 cm vs I-III résidus >1 cm vs IV etstades III et IV inopérables) • Délai de début de traitement (< 4 vs > 4 semaines après la chirurgie) • Groupe GCIG * Déc 2006 à Fév 2009 D’après Perren T et al., ESMO 2011, LBA4 D’après Kristensen G et al., ASCO 2011, LBA5006
2 Analyse intermédiaire de la survie globale(à la demande des autorités de régulation) 1 0,75 Proportion en vie 0,50 0,25 0 0 3 6 9 12 15 18 21 24 27 30 33 36 39 Mois Patients à risque Contrôle 764 741 724 703 672 646 623 542 421 304 212 132 71 26 BV 764 753 737 717 702 680 657 592 459 329 228 129 69 19 D’après Kristensen G et al., abstr. LBA5006 actualisé
3 Survie globale Sous-groupe à haut risque 1 0,75 Proportion en vie 0,50 0,25 0 0 3 6 9 12 15 18 21 24 27 30 33 36 39 Mois Patients à risque Contrôle 234 219 194 166 107 46 15 Bev 231 222 208 186 134 65 18 D’après Kristensen G et al., abstr. LBA5006 actualisé