Download
1 / 26
260 likes | 371 Views
Assignment of single particle configurations in odd-A nuclei near A~100 with angular correlation measurements. A.V. Ramayya and J.H. Hamilton Vanderbilt University. EXPERIMENTAL METHODS. Lawrence Berkeley National Laboratory

E N D
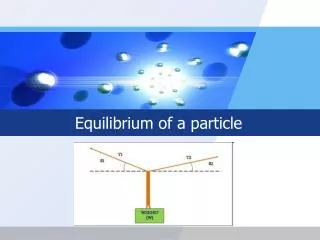
Assignment of single particle configurations in odd-A nuclei near A~100 with angular correlation measurements A.V. Ramayya and J.H. Hamilton Vanderbilt University
EXPERIMENTAL METHODS • Lawrence Berkeley National Laboratory • Gammasphere Detector Array with 101 Compton-suppressed Ge Detectors • 252Cf Source of 62 mCi is sandwitched between two iron foils. • Total of 5.7x10¹¹ triple – and higher –fold g-g-g coincidence events (in cube) • Radware software package to analyze data • Angular correlation of cascades of gamma rays.
I1 d1 g1(L1L1) I2 d2 g2(L2L2) I3
If the intermediate state interacts with a magnetic field of sufficient strength for a sufficient length of time, then the experimentally observed correlation will be attenuated. • Specifically, for a constant magnetic field, B, a nucleus with spin I and magnetic moment m will precess about the direction of B with the Larmor precession frequency.
The Larmor Precession frequency, wL mean precession angle, f BHF : nuclear hyperfine field t : mean life time
Detector response function • For a typical angular correlation measurement, it is necessary to calculate a solid angle correction Qk for each parameter Ak. • However, for very low intensity transitions, the sensitivity of the angular correlation measurement can be improved by the detector response function Rn (q, E1, E2). • For a given detector pair, the response function describes the distribution of possible angles about the central angle of the pair as a function of energy. The response functions for each pair can then be summed to find the response function of each angle bin.
We calculate the response function using a simple Monte Carlo simulation, with the g ray transport simulated up to the first collision. This is equivalent to the traditional calculation of Qk. • The mean free path, l(E), of g-rays was calculated using the known Gammasphere detector properties. • The energy dependence of Rn (q, E1, E2) is negligible, and so only Rn (q) was calculated.
17 groups of 64 bins (1,2), (3,4,5,6), (7,8,9,10), (12,13,14,15), (16,17,18), (19,20,21,22,23), (24,25,26), (27,28,29), (30,31,32,33,34), (35,36,37), (38,39,40), (41,42,43,44,45), (46,47,48), (49,50,51,52), (54,55,56,57), (58,59,60,61), (62,63)
f f
4+ 462.8 keV 2+ A2(theory) = 0.102 A4(theory) = 0.0089 t1/2=0.2 ps 1435.8 keV 0+ 138Ba
Mixing ratios of DI=1 transitions within a rotational band gR = ½(Z/A), gK : intrinsic g factor a: Nilsson coefficients, gl=0, gseff=-2.296 Ref.: S,G. Nilsson, Nat. Fys. Medd. Dan. Vis. Selsk., 29 (1955).
13/2 - 390.6 11/2 - 9/2 - 283.2 138.3 7/2 - 95.3 5/2 -
9/2 - 138.3 7/2 - 232.8 95.3 5/2 -
9/2- 166.6 7/2+ 150.2 5/2+