Download
1 / 23
240 likes | 521 Views
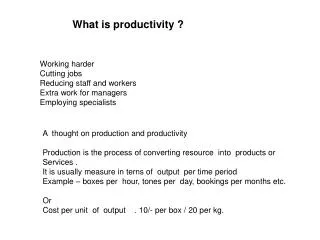
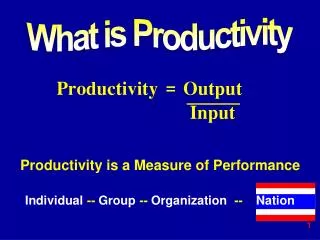
PRIMARY PRODUCTIVITY Productivity is the rate of biomass formation Primary productivity (photosynthesis) of phytoplankton can be measured directly by O 2 production Photosynthesis can be summarized as 6CO 2 + 12 H 2 0 ----> C 6 H 12 O 6 + 6O 2 + 6H 2 O

E N D
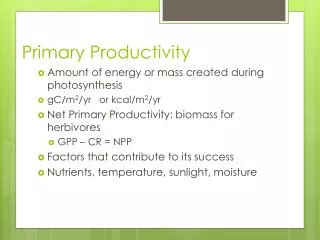
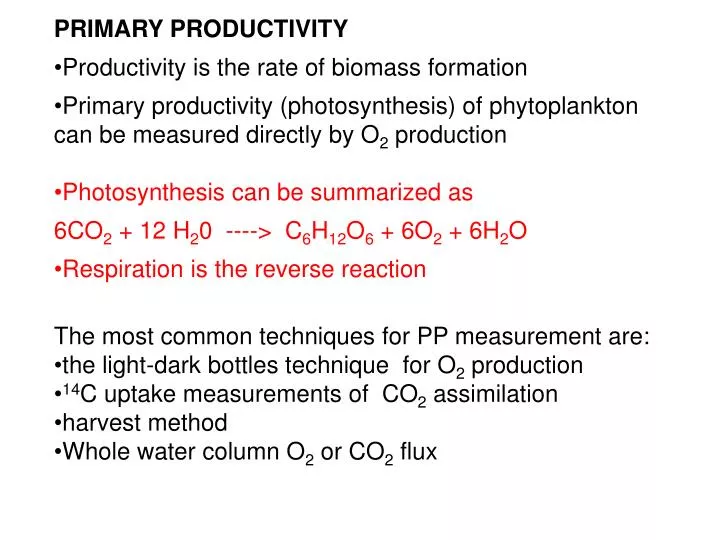
PRIMARY PRODUCTIVITY • Productivity is the rate of biomass formation • Primary productivity (photosynthesis) of phytoplankton can be measured directly by O2 production • Photosynthesis can be summarized as • 6CO2 + 12 H20 ----> C6H12O6 + 6O2 + 6H2O • Respiration is the reverse reaction • The most common techniques for PP measurement are: • the light-dark bottles technique for O2 production • 14C uptake measurements of CO2 assimilation • harvest method • Whole water column O2 or CO2 flux
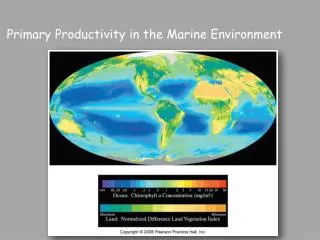
Primary Producers in Aquatic Ecosystems Cyanobacteria, Protista (microalgae, macroalgae), Aquatic plants These groups are all found in both standing and flowing water In standing water the two main primary producer communities are: a.) the phytoplankton (suspended cells or colonies of microalgae or cyanobacteria) b.) the littoral community (benthic micro- or macroalgae or cyanobacteria, epiphytic microalgae, and macophytes (macroalgae or plants)-emergent/submerged In running water the two main primary producer communities are: a.) benthic algae attached to rocks (generally in fast current) b.) submerged macrophytes & associated epiphytes—in areas of slow current
Nightime Afternoon mg/L O2 mg/L O2 2 2 4 4 8 8 10 10 6 6 5 5 Depth m Depth m 10 10 Average [O2] Epilimnion = 9.8 mg/L Average [O2] Epilimnion = 6.9 mg/L
Van Dorn sampler obtains samples of water from a desired depth
Changes in Dissolved Oxygen • Water samples from various depths are enclosed in light (transparent) and dark (completely opaque) bottles, • For each depth initial readings of dissolved O2 are taken (IB) and • the light (LB) and dark (DB) samples are incubated for a period long enough to produce measurable changes in O2. • During the incubation, we expect that the initial DO concentration (IB) at a given depth will decrease to a lower concentration in the dark bottles (DB) due to respiration of phytoplankton. • Conversely, we expect light bottle (LB) should increase from their initial values (IB).
Productivity measurements are usually expressed in terms of carbon not oxygen Therefore we need to convert the changes in oxygen concentration to corresponding changes in carbon. For this we use the photosynthetic quotient (PQ) and the respiratory quotient (RQ), which are ratios describing the relative amounts of oxygen and carbon involved in photosynthesis and respiration. : PQ = (molecules of oxygen liberated during photosynthesis) / (molecules of CO2 assimilated)= usually around 1.2 RQ = (molecules of CO2 liberated during respiration) / (molecules of oxygen consumed) = usually very close to 1.0
Calculations • Gross photosynthesis = [(LB - DB) * 1000 * 0.375] / (PQ *D t) • Net photosynthesis = [(LB - IB) * 1000 * 0.375] / (PQ * D t) • Respiration = [(IB - DB) * RQ * 1000 * 0.375] / D t • Gross and net photosynthesis and respiration are expressed as mg C/m3/t • LB, DB, and IB are dissolved oxygen concentrations in mg/L • D t is the incubation period eg. hours • 1000 converts L to m3 (1 L = 1000 cm3) • 0.375 converts mass of oxygen to mass of carbon and is a ratio of moles of carbon to moles of oxygen (12 mg C/32 mg O2 = 0.375)
Because we are using bottles incubated at various depths in the photic zone to measure primary productivity in situ, and the measurements vary with depth, we need to obtain a profile of primary productivity with depth. % of surface irradiance Primary productivity (mgC/m3/d) Depth (z) Let us say that we wish to incubate samples at the 75% , 50%, 25%, 10% and 1% light levels. How do we decide at what depths to incubate samples at?
Light extinction --Light enters from above and its intensity (I) is sharply attenuated with depth (z)—absorption by water or solute molecules or scattered by particles Section 10.6 Iz z 50% Photic zone z 10% z 1% z Page 144 in text
For a lake with Secchi disk transparency of 3m k=0.57 (1.7/3)
If we place dark and light bottles at each of these depths, and calculate the Gross Primary productivity at each GPPz gC/m3/d 1.5 1.0 0.5 z 75% x z 50% x Photic zone Find the area under the GPP vertical profile Its units will be gC/m2/d, Why? x z 10% x m z 1% x z
If we place dark and light bottles at each of these depths, and calculate the Gross Primary productivity at each GPPz gC/m3/d 1.5 1.0 0.5 x 1.0 x x 3.0 x 5.0 7.0 x m Find the area under the GPP vertical profile Its units will be gC/m2/d, Why? 0.45 sq in B Photic zone Area B represents 0.5 gC/m3/d * 2 m = 1.0 gC/m2/d A Area A represents [4.10/0.45] *1.0 gC/m2/d=9.1 gC/m2/d Average productivity per unit volume 9.1gC/m2/d / 9.1 m = 1.0 gC/m3/d If you average all the GPP estimates 1.2,1.65,1.70, 1.1,0.22, =1.17 gC/m3/d x 9.1 m = 10.7 gC/m2/d 4.10 sq in z Averaging the readings leads to a nearly 20% overestimate, Why?
Primary producers differ in their photosynthetic responses to light intensity
A GPP/t per unit of biomass B C Light intensity 25% 10% 50% Comparing the Photosynthethis/irradiance curves among species
A GPP/t per unit of biomass B C Light intensity 25% 10% 50% Assuming that A, B and C are similar in all respects other than their P/I curves, which of these species would you expect to perform best in the well mixed water column of a deep lake (25% light level at 10 m, max depth 100 m) a) A b) B c) C d) A and B would do equally well e) A and C would do equally well
A GPP/t per unit of biomass B C Light intensity 25% 10% 50% Assuming that A and B are equal in all respects other than their P/I curves, under what conditions would you expect B to outperform A? a) in the epilimnion of a clear stratified lake, (Assume 25% light level at the thermocline) b) in the well-mixed water column of a deep lake (Assume 25% light level at 10m, max depth 100 m) c) in the hypolimnion of a clear stratified lake (Assume 25% light level at the thermocline) d) growing on the substrate near shore in the littoral zone of a clear lake (assume 25 % light level at the outer boundary of the littoral) e) both a and d f) both b and c Could C ever be expected to dominate?
The seasonal dyanamics of the phytoplankton in lakes • Temperature adaptations of different algal groups • Thermal stratification, sinking rates and nutrient dynamics • Food-web interaction—effects of grazing zooplankton • mid-summer low biomass • community shifts to inedible forms
Early spring—diatoms dominate--under cold temperatures and low light conditions plenty of nutrients in the well mixed water column Summer—lake warms up, thermocline forms diatoms fall out of the mixing layer—low viscosity and low mixing depth Asterionella the only diatom that can still hang in. Mid-summer—nutrients lost from mixed layer (sedimentation of algae), warm temperatures favour green algae, and zooplankton herbivory is high favouring fast growing small species eg Chlorella Late summer—herbivores eliminate edible species, large colonial cyanobacteria dominate eg. Microcystis Fall—water cooling, thermocline breaks up, mixing depth increases, nutrients increase, diatoms dominate Winter—low light and cold temp low biomass
The photosynthesis versus irradiance (light intensity) curve