Download
1 / 77
800 likes | 1.19k Views
Chapter 16 Our Star, The Sun. The material of Chapter 16 introduces the Sun, the closest example of a star and the only one that we can view in sufficient detail to resolve features of its surface (and interior !).

E N D
Chapter 16Our Star, The Sun The material of Chapter 16 introduces the Sun, the closest example of a star and the only one that we can view in sufficient detail to resolve features of its surface (and interior !). 1. Examine the characteristic features of the Sun ― photosphere, chromosphere, corona ― and how they change with time. 2. Study the activity cycle of the Sun and learn about its deep interior, where sunlight is generated.
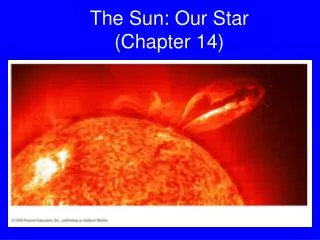
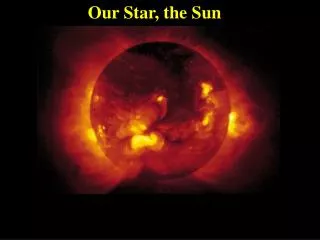
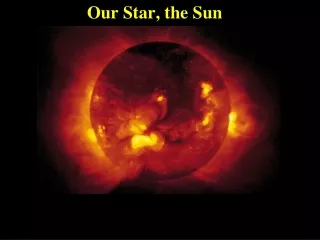
A typical view of the Sun: a spherical star that exhibits limb-darkening (brightness drops towards the edge) and a nearly featureless disk.
The Sun has actually changed in size and temperature since it first formed 4½ billion years ago.
Like all stars, the Sun is in hydrostatic equilibrium (balance), otherwise its size would change very quickly ! The weight of each layer in the Sun is balanced by the buoyant force exerted by the pressure exerted by gas below it. The pressure comes from radiation (light) and the high temperature of the gas. The ultimate power source is nuclear fusion in the Sun’s core.
The core is where hydrogen is converted to helium via the proton-proton chain, Tcritical = 10 million K. H1 + H1 → D2 + positron D2 + H1 → He3 He3 + He3 → He4 + 2H1
The proton-proton chain in the 15 million K Sun’s core simplified.
The source of energy in the Sun’s core is the same as that which powers an H bomb (hydrogen bomb).
The short-wavelength gamma rays produced in the core of the Sun gradually diffuse outwards, scattered (absorbed and re-emitted at slightly lower energies) to longer wavelengths by interactions with gas atoms and ions until they eventually emerge at the Sun’s surface 10,000-200,000 years later as visible light photons.
Neutrinos, on the other hand, do not interact with gas atoms and ions at all, and reach Earth 8⅓ minutes later, detected only through the occasional interactions they make with atoms of some substances.
The Solar Neutrino Problem The observed flux of neutrinos at Earth is on the order of ⅓ to ½ the amount predicted by the Standard Solar Model. Current thinking in subatomic physics suggests that the electron neutrinos generated in the Sun’s core are oscillating between the states of electron and muon neutrinos on their way to Earth, so that detectors on Earth, tuned to detect electron neutrinos, are missing half of neutrinos actually generated by the Sun.
The heat of the Sun diffuses outwards by simple radiative transfer in the deep interior, but is helped by convective eddies over the last 28.6%.
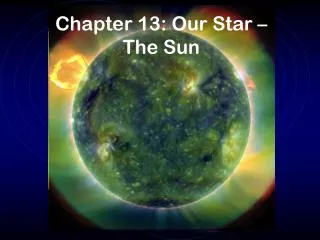
Solar granulation: an indication of the outer convective region of the Sun. Shock waves from the convection zone also heat the gas in solar chromosphere and corona to very high temperatures.
Models of the Sun’s interior make use of mathematical relationships describing the conditions of hydrostatic equilibrium, thermal equilibrium, radiative equilibrium, and the general continuity of mass in the Sun in order to calculate the mass, density, temperature, and pressure at all points in the solar interior. The “standard solar model” is well verified by observation, including helioseismology, which matches the oscillations seen at the Sun’s surface with the parameters of seismic waves passing through the Sun’s outer regions. Neutrinos detected from the Sun’s core also provide information about the nuclear reactions occurring there.
Bright = Hot Dark = Cool
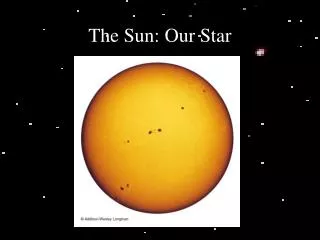
White light images of the Sun showing sunspots, limb darkening, and the solar rotation. The orange “surface” is the solar photosphere = light sphere.
The motion of sunspots across the Sun’s disk indicates that the Sun rotates differentially, that is the equatorial regions rotate faster than regions near the poles. Observations indicate a rotational period of 24½ days at the solar equator and 30 days 60° away from the equator, corresponding to observed rates from Earth (synodic rates) of ~27 days and ~32 days, respectively. Differential rotation also occurs in the gaseous planets Jupiter and Saturn. On the Sun it is responsible for twisting up the subsurface toroidal magnetic field.
Sunspots are cool regions (T ~ 4500K) of the photosphere, where strong magnetic fields have restricted normal turbulence. Because they are cooler than the surrounding photosphere (T ~ 5800K) they are less radiative, and appear dark through contrast with the brighter photosphere.
The limb darkening of the Sun has a similar explanation. Our line of sight at the edge of the solar disk penetrates to shallower, cooler depths than does the line of sight at disk centre.
The “optical depth” to which we can see into the Sun’s photosphere (“photon” sphere) is about the same no matter where we look, but we can see to deeper, hotter regions near disk centre.
Sunspots, and the sunspot cycle of ~11 years. The number of spots increases rapidly and declines slowly during the 11-year sunspot cycle. (Sunspot number is a curious function that counts 10 for each spot group, and 1 for each individual spot.)
Sunspots are associated with strong magnetic regions of the photosphere, and cycle through different latitude regions during the 11-year cycle, beginning near both poles, ending near the equator (“butterfly” diagram).
The chromosphere as seen in the light of Hα radiation (right) and at the limb, where spicules are visible (below right).
Active (magnetic) regions in the solar chromosphere seen in spectroheliograms taken in the light of Ca K radiation. Bright regions are called plages or faculae.
More views of the chromosphere from Hαspectroheliograms. A solar flare is developing at right.