Download
1 / 1
10 likes | 140 Views
Ion Concentration Variability in LM Effluent over Time. Winter Break. Ion Concentration (scaled to maximum value). School Starts. Winter Break. NH 4 + (max value = 3.42 mol/L). Cl - (5.14E-02). NO 2 - (3.35E-04). PO 4 3- (5.54E-04). NO 3 - (2.10E-03). SO 4 2- (4.33E-03).

E N D
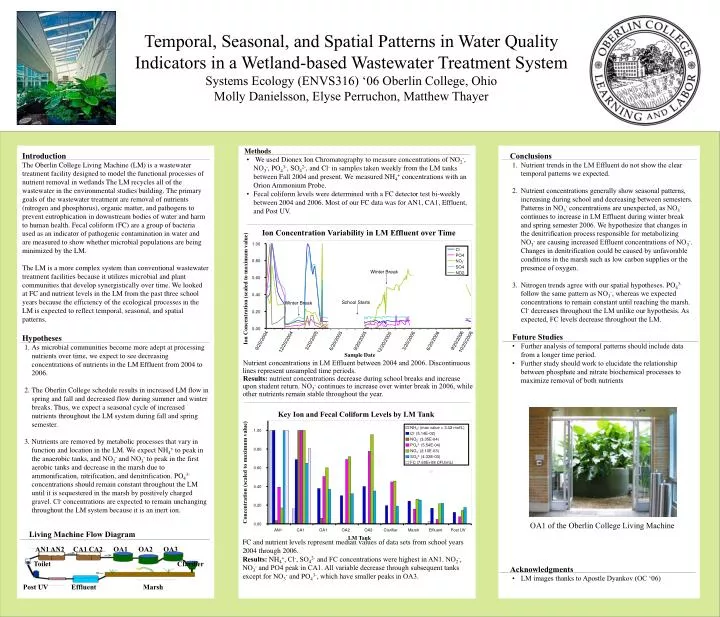
Ion Concentration Variability in LM Effluent over Time Winter Break Ion Concentration (scaled to maximum value) School Starts Winter Break NH4+ (max value = 3.42 mol/L) Cl- (5.14E-02) NO2- (3.35E-04) PO43- (5.54E-04) NO3- (2.10E-03) SO42- (4.33E-03) FC (7.60E+08 CFU/mL) Temporal, Seasonal, and Spatial Patterns in Water Quality Indicators in a Wetland-based Wastewater Treatment System Systems Ecology (ENVS316) ‘06 Oberlin College, Ohio Molly Danielsson, Elyse Perruchon, Matthew Thayer • Introduction • The Oberlin College Living Machine (LM) is a wastewater treatment facility designed to model the functional processes of nutrient removal in wetlands The LM recycles all of the wastewater in the environmental studies building. The primary goals of the wastewater treatment are removal of nutrients (nitrogen and phosphorus), organic matter, and pathogens to prevent eutrophication in downstream bodies of water and harm to human health. Fecal coliform (FC) are a group of bacteria used as an indicator of pathogenic contamination in water and are measured to show whether microbial populations are being minimized by the LM. • The LM is a more complex system than conventional wastewater treatment facilities because it utilizes microbial and plant communities that develop synergistically over time. We looked at FC and nutrient levels in the LM from the past three school years because the efficiency of the ecological processes in the LM is expected to reflect temporal, seasonal, and spatial patterns. • Hypotheses • As microbial communities become more adept at processing nutrients over time, we expect to see decreasing concentrations of nutrients in the LM Effluent from 2004 to 2006. • The Oberlin College schedule results in increased LM flow in spring and fall and decreased flow during summer and winter breaks. Thus, we expect a seasonal cycle of increased nutrients throughout the LM system during fall and spring semester. • Nutrients are removed by metabolic processes that vary in function and location in the LM. We expect NH4+ to peak in the anaerobic tanks, and NO2- and NO3- to peak in the first aerobic tanks and decrease in the marsh due to ammonification, nitrification, and denitrification. PO43- concentrations should remain constant throughout the LM until it is sequestered in the marsh by positively charged gravel. Cl- concentrations are expected to remain unchanging throughout the LM system because it is an inert ion. • Methods • We used Dionex Ion Chromatography to measure concentrations of NO2-, NO3-, PO43-, SO42-, and Cl- in samples taken weekly from the LM tanks between Fall 2004 and present. We measured NH4+ concentrations with an Orion Ammonium Probe. • Fecal coliform levels were determined with a FC detector test bi-weekly between 2004 and 2006. Most of our FC data was for AN1, CA1, Effluent, and Post UV. • Conclusions • Nutrient trends in the LM Effluent do not show the clear temporal patterns we expected. • Nutrient concentrations generally show seasonal patterns, increasing during school and decreasing between semesters. Patterns in NO3- concentrations are unexpected, as NO3- continues to increase in LM Effluent during winter break and spring semester 2006. We hypothesize that changes in the denitrification process responsible for metabolizing NO3- are causing increased Effluent concentrations of NO3-. Changes in denitrification could be caused by unfavorable conditions in the marsh such as low carbon supplies or the presence of oxygen. • Nitrogen trends agree with our spatial hypotheses. PO43- follow the same pattern as NO3-, whereas we expected concentrations to remain constant until reaching the marsh. Cl- decreases throughout the LM unlike our hypothesis. As expected, FC levels decrease throughout the LM. Future Studies • Further analysis of temporal patterns should include data from a longer time period. • Further study should work to elucidate the relationship between phosphate and nitrate biochemical processes to maximize removal of both nutrients • OA1 of the Oberlin College Living Machine • Acknowledgments • LM images thanks to Apostle Dyankov (OC ‘06) 1.00 Cl PO4 0.80 NO3- SO4 NO2 0.60 0.40 0.20 0.00 9/20/2004 3/20/2005 9/20/2006 6/20/2005 9/20/2005 3/20/2006 6/20/2006 12/20/2004 10/20/2006 12/20/2005 Sample Date Nutrient concentrations in LM Effluent between 2004 and 2006. Discontinuous lines represent unsampled time periods. Results: nutrient concentrations decrease during school breaks and increase upon student return. NO3- continues to increase over winter break in 2006, while other nutrients remain stable throughout the year. Key Ion and Fecal Coliform Levels by LM Tank 1.00 0.80 0.60 Concentration (scaled to maximum value) 0.40 0.20 0.00 AN1 CA1 OA1 OA2 OA3 Clarifier Marsh Effluent Post UV Living Machine Flow Diagram AN1 AN2 CA1 CA2 OA1 OA2 OA3 Toilet Clarifier Post UV Effluent Marsh LM Tank FC and nutrient levels represent median values of data sets from school years 2004 through 2006. Results:NH4+, Cl-, SO42- and FC concentrations were highest in AN1. NO2-, NO3- and PO4 peak in CA1. All variable decrease through subsequent tanks except for NO3- and PO43-, which have smaller peaks in OA3.