Download
1 / 1
10 likes | 110 Views
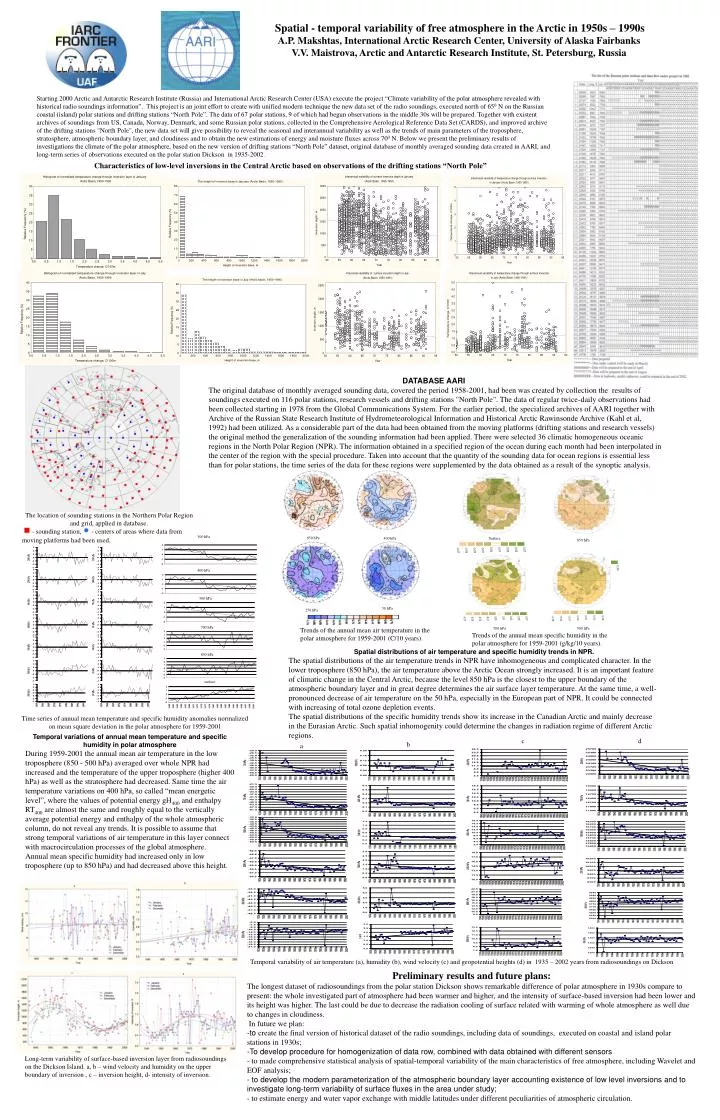
Surface. 850 hPa. 850 hPa. 400 hPa. 300 hPa. 50 hPa. 250 hPa. 700 hPa. 500 hPa. 400 hPa. 500 hPa. 700 hPa. 850 hPa. surface. Spatial - temporal variability of free atmosphere in the Arctic in 1950s – 1990s

E N D
Surface 850 hPa 850 hPa 400 hPa 300 hPa 50 hPa 250 hPa 700 hPa 500 hPa 400 hPa 500 hPa 700 hPa 850 hPa surface Spatial - temporal variability of free atmosphere in the Arctic in 1950s – 1990s A.P. Makshtas, International Arctic Research Center, University of Alaska Fairbanks V.V. Maistrova, Arctic and Antarctic Research Institute, St. Petersburg, Russia Starting 2000 Arctic and Antarctic Research Institute (Russia) and International Arctic Research Center (USA) execute the project “Climate variability of the polar atmosphere revealed with historical radio soundings information”. This project is an joint effort to create with unified modern technique the new data set of the radio soundings, executed north of 650 N on the Russian coastal (island) polar stations and drifting stations “North Pole”. The data of 67 polar stations, 9 of which had begun observations in the middle 30s will be prepared. Together with existent archives of soundings from US, Canada, Norway, Denmark, and some Russian polar stations, collected in the Comprehensive Aerological Reference Data Set (CARDS), and improved archive of the drifting stations "North Pole", the new data set will give possibility to reveal the seasonal and interannual variability as well as the trends of main parameters of the troposphere, stratosphere, atmospheric boundary layer, and cloudiness and to obtain the new estimations of energy and moisture fluxes across 700 N. Below we present the preliminary results of investigations the climate of the polar atmosphere, based on the new version of drifting stations “North Pole” dataset, original database of monthly averaged sounding data created in AARI, and long-term series of observations executed on the polar station Dickson in 1935-2002. Characteristics of low-level inversions in the Central Arctic based on observations of the drifting stations “North Pole” DATABASE AARI The original database of monthly averaged sounding data, covered the period 1958-2001, had been was created by collection the results of soundings executed on 116 polar stations, research vessels and drifting stations "North Pole". The data of regular twice-daily observations had been collected starting in 1978 from the Global Communications System. For the earlier period, the specialized archives of AARI together with Archive of the Russian State Research Institute of Hydrometeorological Information and Historical Arctic Rawinsonde Archive (Kahl et al, 1992) had been utilized. As a considerable part of the data had been obtained from the moving platforms (drifting stations and research vessels) the original method the generalization of the sounding information had been applied. There were selected 36 climatic homogeneous oceanic regions in the North Polar Region (NPR). The information obtained in a specified region of the ocean during each month had been interpolated in the center of the region with the special procedure. Taken into account that the quantity of the sounding data for ocean regions is essential less than for polar stations, the time series of the data for these regions were supplemented by the data obtained as a result of the synoptic analysis. The location of sounding stations in the Northern Polar Region and grid, applied in database. - sounding station, - centers of areas where data from moving platforms had been used. Trends of the annual mean air temperature in the polar atmosphere for 1959-2001 (C/10 years). Trends of the annual mean specific humidity in the polar atmosphere for 1959-2001 (g/kg/10 years). Spatial distributions of air temperature and specific humidity trends in NPR. The spatial distributions of the air temperature trends in NPR have inhomogeneous and complicated character. In the lower troposphere (850 hPa), the air temperature above the Arctic Ocean strongly increased. It is an important feature of climatic change in the Central Arctic, because the level 850 hPa is the closest to the upper boundary of the atmospheric boundary layer and in great degree determines the air surface layer temperature. At the same time, a well-pronounced decrease of air temperature on the 50 hPa, especially in the European part of NPR. It could be connected with increasing of total ozone depletion events. The spatial distributions of the specific humidity trends show its increase in the Canadian Arctic and mainly decrease in the Eurasian Arctic. Such spatial inhomogenity could determine the changes in radiation regime of different Arctic regions. Time series of annual mean temperature and specific humidity anomalies normalized on mean square deviation in the polar atmosphere for 1959-2001 Temporal variations of annual mean temperature and specific humidity in polar atmosphere During 1959-2001 the annual mean air temperature in the low troposphere (850 - 500 hPa) averaged over whole NPR had increased and the temperature of the upper troposphere (higher 400 hPa) as well as the stratosphere had decreased. Same time the air temperature variations on 400 hPa, so called “mean energetic level”, where the values of potential energy gH400 and enthalpy RT400 are almost the same and roughly equal to the vertically average potential energy and enthalpy of the whole atmospheric column, do not reveal any trends. It is possible to assume that strong temporal variations of air temperature in this layer connect with macrocirculation processes of the global atmosphere. Annual mean specific humidity had increased only in low troposphere (up to 850 hPa) and had decreased above this height. c d b a Temporal variability of air temperature (a), humidity (b), wind velocity (c) and geopotential heights (d) in 1935 – 2002 years from radiosoundings on Dickson • Preliminary results and future plans: • The longest dataset of radiosoundings from the polar station Dicksonshows remarkable difference of polar atmosphere in 1930s compare to present: the whole investigated part of atmosphere had been warmer and higher, and the intensity of surface-based inversion had been lower and its height was higher. The last could be due to decrease the radiation cooling of surface related with warming of whole atmosphere as well due to changes in cloudiness. • In future we plan: • to create the final version of historical dataset of the radio soundings, including data of soundings, executed on coastal and island polar stations in 1930s; • To develop procedure for homogenization of data row, combined with data obtained with different sensors • to made comprehensive statistical analysis of spatial-temporal variability of the main characteristics of free atmosphere, including Wavelet and EOF analysis; • to develop the modern parameterization of the atmospheric boundary layer accounting existence of low level inversions and to investigate long-term variability of surface fluxes in the area under study; • to estimate energy and water vapor exchange with middle latitudes under different peculiarities of atmospheric circulation. Long-term variability of surface-based inversion layer from radiosoundings on the Dickson Island. a, b – wind velocity and humidity on the upper boundary of inversion , c – inversion height, d- intensity of inversion.