Download
1 / 1
10 likes | 147 Views
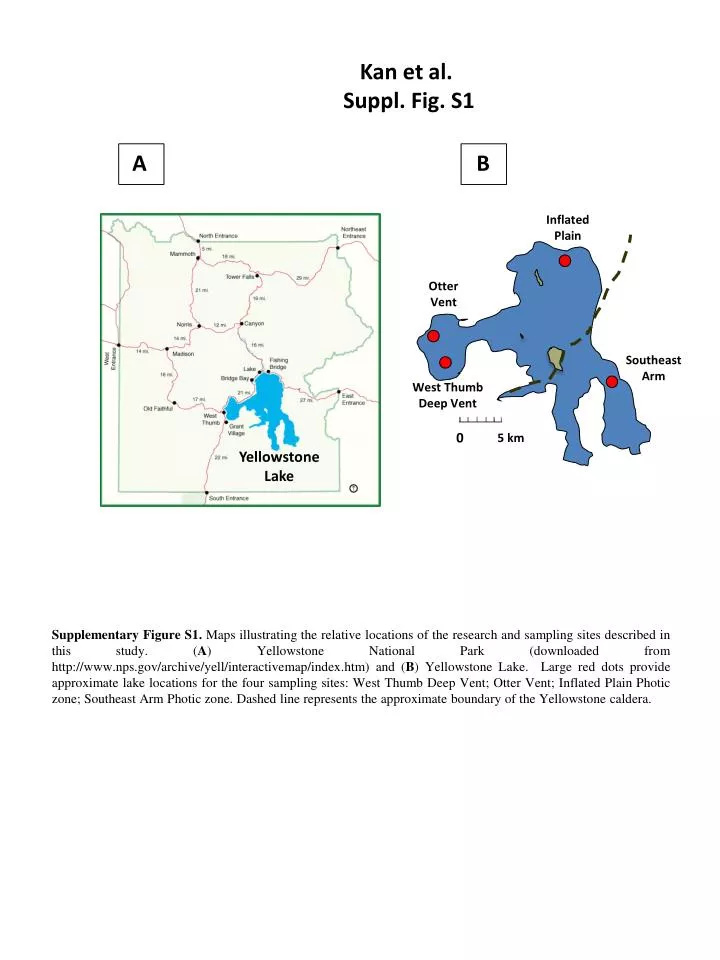
Kan et al. Suppl. Fig. S1. A. B. Inflated Plain. Otter Vent. Southeast Arm. West Thumb Deep Vent. 0. 5 km. Yellowstone Lake.

E N D
Kan et al. Suppl. Fig. S1 A B Inflated Plain Otter Vent Southeast Arm West Thumb Deep Vent 0 5 km Yellowstone Lake Supplementary Figure S1. Maps illustrating the relative locations of the research and sampling sites described in this study. (A) Yellowstone National Park (downloaded from http://www.nps.gov/archive/yell/interactivemap/index.htm) and (B) Yellowstone Lake. Large red dots provide approximate lake locations for the four sampling sites: West Thumb Deep Vent; Otter Vent; Inflated Plain Photic zone; Southeast Arm Photic zone. Dashed line represents the approximate boundary of the Yellowstone caldera.