Download
1 / 14
160 likes | 363 Views
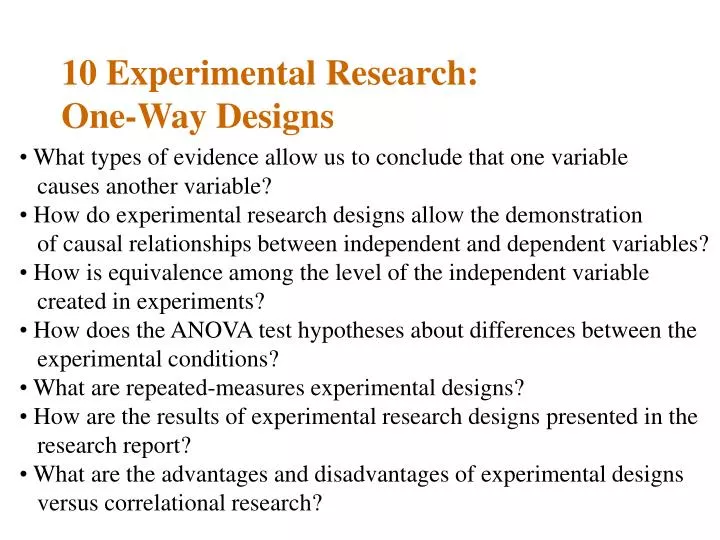
10 Experimental Research: One-Way Designs. What types of evidence allow us to conclude that one variable causes another variable? How do experimental research designs allow the demonstration of causal relationships between independent and dependent variables?

E N D
10 Experimental Research: One-Way Designs • What types of evidence allow us to conclude that one variable • causes another variable? • How do experimental research designs allow the demonstration • of causal relationships between independent and dependent variables? • How is equivalence among the level of the independent variable • created in experiments? • How does the ANOVA test hypotheses about differences between the • experimental conditions? • What are repeated-measures experimental designs? • How are the results of experimental research designs presented in the • research report? • What are the advantages and disadvantages of experimental designs • versus correlational research?
Demonstration of Causality Association If there is a causal relationship between IV and DV, there must be a strong correlation between them. Temporal Priority IV must be an antecedent of the DV. Control of Common-causal Variable The influence of common-causal variables that may have produced spurious relationships between IV and DV should be ruled out.
One-Way Experimental Design Example: Violent cartoons increase children’s aggressive behaviors. 1) Define a independent variable and its levels (experimental condition) 2) Create equivalence either through use of different participants (between-participant designs) or through use of the same participants in each of experimental conditions (repeated-measure designs = within-participant designs) 3) Assign participants to each level randomly. 4) Select a dependent variable
Analysis of Variance (ANOVA) A statistical procedure that is specially designed to compare the means of the dependent variables across the levels of an experimental research design (the independent variable). Example: Violent cartoons increase children’s aggressive behaviors. IV: Violent Cartoons vs. Nonviolent Cartoons DV: Children’s aggressive behaviors
Hypothesis Testing in Experimental Design Null Hypothesis H0: MeanViolentcartoons = MeanNonviolentCartoons Research Hypothesis H1: MeanViolentcartoons > MeanNonviolentCartoons There is a specific difference among the conditions so that Mean(violent) is greater than M(nonviolent).
Between-Groups and Within-Groups Variance Estimates Variance A measure of dispersion of the scores on a variable. The ANOVA compares the variance of the means of the dependent variable between the different levels to the variance of individuals on the dependent variable within each of the conditions Between-Group Variance The variance among the condition means Within-Group Variance The variance within the conditions
Data Violent Nonviolent 5 2 3 1 4 3 3 2 4 1 5 3 Within-Groups Variance Mean(violent) = 4 Mean(violent) = 2 Total mean = 3 Between Group Variance
F value Between-groups variance F = Within-groups variance As the Between-groups variance increases in comparison to the Within-groups variance F increases P value will be less than alpha
ANOVA Summary Table Source Sum of df Mean F p-value Squares Square DV: Aggressive Play Between 14.40 1 14.40 10.98 .002 Within 49.78 38 1.31 Total 64.18
Presentation of Experiment Results Degree of freedom (# of Within-Groups - 1) p value F value Degree of freedom (# of Between-Groups - 1) There were significant differences on rated aggression across the levels of the cartoon condition, F (1, 38) = 10.98, p < .01. Children who viewed the violent cartoons (M = 2.89) were rated as playing more aggressively than children who had viewed the nonviolent cartoons (M = 1.52) The mean value of the nonviolent condition The mean value of the violent condition
Between-Participants Designs and Repeated-Measure Designs B-P Design R-M Design Ps Ps Violent Cartoons Nonviolent Cartoons Violent Cartoons Nonviolent Cartoons Aggressive Play Aggressive Play Nonviolent Cartoons Violent Cartoons Aggressive Play Aggressive Play Aggressive Play Aggressive Play
Advantages and Disadvantages of Repeated-Measure Designs 1) Increase Statistical Power 2) Economize Participants X 1) The first measure will influence the second measure. (carryover) 2) Participants might become fatigued in the second measure. 3) Participants performance might improve on the task over time through practice.
Counterbalancing Arranging the order in which the conditions of a repeated-measures design are experienced. P1 P2 P3 Latin Square Designs S1 S2 S3 A B C B C A C A B A method of counterbalancing the order of conditions so that each condition appears in each order but also follows equally often after each of the order conditions.
Advantages and Disadvantages of Experiments The experiment design allow us to draw conclusions about causal relationships between the independent and dependent variables. The experiment design can not manipulate a person’s sex, race, intelligence, family variables, and religious background. X X The experiment design will not observe participant’s reaction exactly as they would behave if observed outside of the lab X The experiment design necessarily oversimplify things.