Download
1 / 28
280 likes | 569 Views
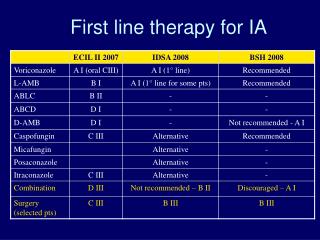
First-Line Screener for Dyscalculia. Update on trials Autumn 2006. Background. Cognitive Model. Conceptual understanding of number, place value Comparative relative size Verbal Symbolic Visual-Spatial. Operational. Conceptual conception of correct operation to

E N D
First-Line Screener for Dyscalculia Update on trials Autumn 2006
Cognitive Model • Conceptual • understanding of number, place value • Comparative • relative size • Verbal • Symbolic • Visual-Spatial
Operational • Conceptual • conception of correct operation to • achieve required outcome • reverse a process • Inferential • given an operational definition • make comparative inferences about an outcome, without realising the outcome • Infer an operational relationship
Abstract Symbolic • Spatial-Temporal • Understanding • Visual-Spatial diagrams • Time • Graphical • Reading and Interpreting • Graphs • Tables
Cognitive Model for Dyscalculia inferential operational abstract conceptual symbolic number conceptual symbolic tables number graphical comparative verbal graphs visual-spatial Direction Spatial- Temporal Time
Phase 1 Developing the Screening Tool • Development of items • Development of the model • Available in both paper and electronic versions
Phase 2: Initial Trials • Involved 19 participants • Organised into three groups Dyscalculic Dyslexic Control • Showed no difference between paper and electronic versions • Showed good discrimination
Phase 3: Further Trials • Involved 30 participants • Organised into three equal groupsDyscalculic Dyslexic Control • Showed good discrimination
100.00 80.00 60.00 40.00 20.00 2 2 2 2 2 2 2 2 2 2 3 3 3 3 3 3 3 3 3 3 1 1 1 1 1 1 1 1 1 1 0 0 0 0 0 0 0 0 0 1 0 0 0 0 0 0 0 0 0 1 0 0 0 0 0 0 0 0 0 1 1 2 3 4 5 6 7 8 9 0 1 2 3 4 5 6 7 8 9 0 1 2 3 4 5 6 7 8 9 0 number Graph: percentage scores on the subtest O dyscalculic O dyslexic O control percent
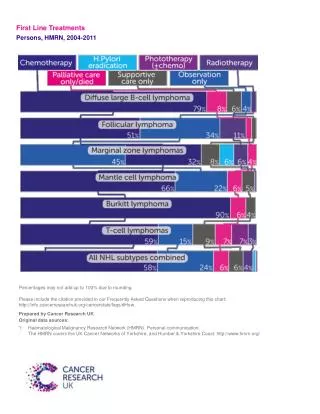
Phase 4: Further Trials • 137 students • Large groups/small groups/individuals • 16 out of 137 identified “at risk” • 8% prevalence • Geary (2004) 5 - 8% • Desoete et al (2004) 3 - 8% • Butterworth (1999) 4 - 6% • Not post-16
Aims of the Trials • Two distinct aims • to collect data on the general population • to collect data about individuals already identified as dyscalculic by EP/Assessor.
“Large-Scale” Trials • Paper-based trials • Whole classes of students (FE and HE) • Paper-based and electronic-based versions shown to be identical in nature • This data establishes the required percentiles for the population
“Small-Scale” Trials • Dyscalculic students • Extended to “mathematical difficulties” • However other students involved (neurodiverse) • Learning support tutors completed a sheet detailing the SpLD identified • “Small-Scale” conducted one-to-one • Electronic-based
“Large-Scale” Trials • 356 students in H.E. (80 in FE) • Percentiles calculated • 8th percentile corresponded to a score of 84% • 2nd percentile to a score of 70% on the screener • “low” and “very low” thresholds, “at risk of dyscalculia” • “very low” still gives a score unlikely to further reduce confidence • history of very low mathematical self-esteem
“Small-Scale” Trials • Involved 89 students • 46 in H.E. • 43 in F.E. • H.E. and F.E. data treated separately
Threshold Total Score Comparative Symbolic Comparative Verbal Comparative Visual-Spatial Conceptual Graphical Operational Conceptual Operational Relational Spatial Directional Spatial Temporal Symbolic Abstraction Tabular Time Taken: 25 Minutes Profiler
2 Dyscalculic Profiles • Symbolic number comparison • Inferential operations • Graph • Time