Download
1 / 16
180 likes | 1.28k Views
Power Function Regression Example: Modeling the period of planetary orbits Scatter plot. Here use regression on this data set to obtain a function o f “best fit” with equation f(x) = ax b . We can use “power regression” on some calculators or in MATLAB the program regressionpower .

E N D
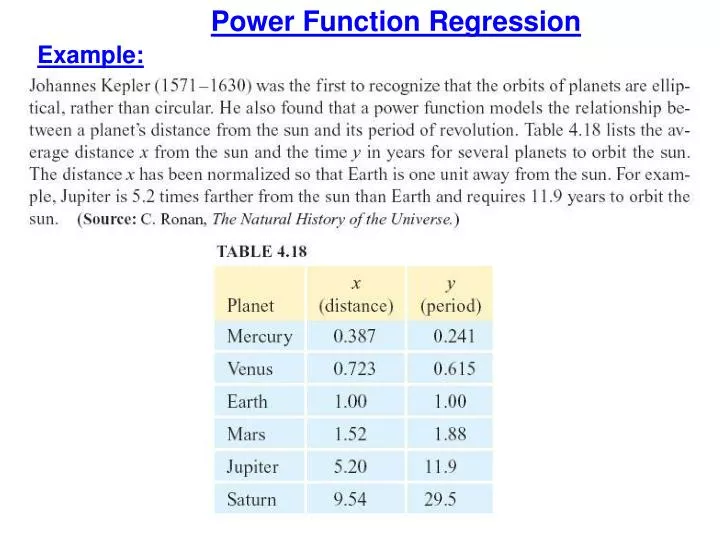
Power Function Regression Example:
Modeling the period of planetary orbits Scatter plot. Here use regression on this data set to obtain a function o f “best fit” with equation f(x) = axb.
We can use “power regression” on some calculators or in MATLAB the program regressionpower. In MATLAB type in the data then choose Johannes Kepler stated his third law as: “It is absolutely certain and exact that the ratio which exists between periodic times of any two plants is precisely the 3/2-th power of mean distances [of the planet to the sun].”
Example: Urban Travel Times The accompanying table shows the 2000 population P, in thousands, for selected cities, together with the average time T, in minutes, spent by residents driving to work.
Example: Urban Travel Times (continued) (a) Construct a power regression model of driving time in minutes as a function of population measured in thousands. We can use “power regression” on some calculators or in MATLAB the program regressionpower.
(b) Use the model to predict the driving time for Philadelphia. Compute the percent of change between the original data and that predicted by the model. T = 9.5296 P0.143 Philadelphia P = 1518 T = 30.3 T = 9.5296 (1518)0.143 ≈ 27.2 predicted driving time percent of change: (c) If the population of the city was 1million, that is P = 1000, what is the predicted driving time? T = 9.5296 (1000)0.143≈ 25.6
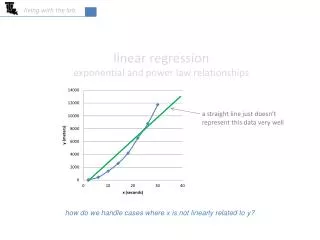
Intensity of Light A light probe can be used to measure the intensity of light coming from light sources. But what happens to the light intensity as you move the probe and the light source further apart? The interactive movie below summarizes an experiment which involved moving a flashlight back and forth away from a probe measuring its light intensity. Be sure to pay attention to how the graph changes! Click on it to play. Source: http://kie.berkeley.edu/ned/data/E01-970419-003/full.html
Using regressionpower Source: http://www.powernaturally.org/Programs/pdfs_docs/25_PV-InverseSquare.pdf lightdata2.m
Under ideal conditions the intensity of light obeys the inverse power rule: Or where x = distance from the source.
Moore’s Law refers to the statement made by Gordon Moore (co-founder of Intel) that the number of transistors per microchip doubles approximately every two years. “Intel scientists have predicted the Moore’s Law for rapid growth in the number of transistors per microchip will continue for a decade or two until transistors size shrinks enough to reach atomic scale limitations.”
The following table shows the number of transistors in an Intel microchip in the year the chip model was introduced. http://www.intel.com/technology/timeline.pdf
Before trying to build a regression model for this data we need to “scale” this data so the numbers are not so large. One way to do this is to replace the YEAR by YEARS since 1970.
Next we scale the number of transistors by dividing each value by 10,000.
Now let’s try a power regression on this scaled data. In Matlab, data is in mooreslawdata.m